8.0 Unit 8 Overview

  • 2 Videos
  • 2 Articles
  • 7 Activities
  • 2 Visual Aids
  • 2 Vocab Activities

Cookie Policy

Our website uses cookies to understand content and feature usage to drive site improvements over time. To learn more, review our Terms of Use and Privacy Policy.

Introduction

The Cold War and decolonization: two different things that happened in different places, right? That sounds simple, but in reality, the Cold War and decolonization were entangled in a complex web of economics, conflict, diplomacy, and espionage (spies!). The Cold War was a global struggle between the capitalist United States and the communist Soviet Union. But the two superpowers weren’t alone in their conflict, and not all conflicts were “cold.” Colonized nations seeking independence, and the empires who ruled them, both found willing partners in the superpowers, who saw their struggle as an opportunity to oppose each other. This overview lesson introduces you to the ways that people and governments tried to reshape the global order after the Second World War.

Learning Objectives

  1. Evaluate how the Cold War and decolonization are intertwined in the history of this period. 
  2. Analyze how the course frames can help to explain the connections between the Cold War and decolonization. 
  3. Learn how to read charts and interpret historical data. 
Video

Unit 8 Overview

Vocab Terms:

  • anti-colonial
  • conflict
  • confrontation
  • decolonization
  • struggle

Summary

The Second World War ended more definitively than the First, and the new United Nations presented a hope for avoiding a Third. To some degree, it succeeded. But the two great victors of the war—the United States and the Soviet Union—circled and poked at each other for more than half a century. They did this partly by taking opposite sides in struggles for independence happening in Africa, Asia, the Pacific, and Latin America.

Unit 8 Overview Video (9:37)

Key Ideas

As this video progresses, key ideas will be introduced to invoke discussion.

Purpose

The Unit 8 Problem asks you to consider two great post-war trends—the Cold War and decolonization—as connected global experiences. In this video, you will be introduced to some evidence and explanations for ways in which these trends together affected people around the world. Later readings, videos, and activities will allow you to evaluate these arguments using further evidence presented at a smaller scale or on a specific theme.

Process

Preview – Skimming for Gist

As a reminder, open and skim the transcript, and read the questions before you watch the video.

Key Ideas – Understanding Content

Think about the following questions as you watch this video:

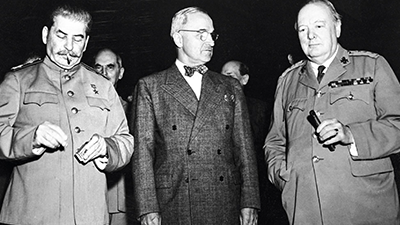
  1. Why did a struggle between the Soviet Union and the United States emerge in the years following the end of the Second World War?
  2. What was one way in which decolonization was a result of the Second World War?
  3. How did the Cold War and decolonization become tied together?
  4. How are the spikes in the US military budget in the 1950s, mid-1960s, and 1980s evidence of the global reach of the Cold War?
  5. What does the collapse of Soviet military spending in 1989 tell us?
  6. Why did Cuban troops get involved in decolonization in Angola, leading to their involvement at the battle of Cuito Cuanavale?

Evaluating and Corroborating

  1. At this point, you have seen two devastating world wars, and two attempts to create world peace at the end of each of them fail. Why do you think it is so difficult to create global peace?

Article

Unit 8 Overview: End of Empire and Cold War

Vocab Terms:

  • apartheid
  • coalition
  • decolonization
  • democracy
  • independence
  • superpower

Preparation

Article
Activity

Summary

The Second World War left Europe devastated, and although it gradually recovered, the focus of world events had shifted elsewhere. The Soviet Union and the United States were now the world’s great superpowers, locked in confrontation with each other. Meanwhile, decolonization struggles gave new opportunities and hopes across Asia, the Caribbean, Africa, and the Pacific, while China loomed large as a rising power.

Purpose

This overview article introduces you to Unit 8. Here, you’ll explore the two global trends studied in this unit: decolonization and the Cold War. The article provides evidence at the global level to help you evaluate how these two conflicts were tangled together. As you read, think about what we gain when we focus on the connections between the Cold War and decolonization.

Process

Preview – Skimming for Gist

Fill out the Skimming for Gist section of the Three Close Reads Worksheet as you complete your first close read. As a reminder, this should be a quick process!

Key Ideas – Understanding Content

For this reading, you should be looking for unfamiliar vocabulary words, the major claim and key supporting details, and analysis and evidence. By the end of the second close read, you should be able to answer the following questions:

  1. How did the Second World War shift the focus of the global story you’ve learned so far?
  2. Why were some conflicts during this period described in different ways (Cold War struggles vs. decolonization) depending on one’s perspective?
  3. How was the Cold War an ideological struggle?
  4. What changes in the world today came about as a result of political independence and decolonization, according to the author?

Evaluating and Corroborating

At the end of the third close read, respond to the following questions:

  1. How did the events of the Cold War and/or decolonization affect people in your family?
  2. How do the ideological differences between the Soviet Union and the United States look when viewed through the communities frame? How do they look when viewed through the production and distribution frame?

Video

Unit 8 Frames

Summary

This period of history is usually viewed through the lens of two different struggles: the Cold War and decolonization. But if examine both struggles using our course frames, then we begin to see how these struggles were intertwined. As new communities or nation-states were formed through decolonization movements, the Soviet Union and the United States sought to establish networks that would extend their ideologies and influence.

Unit 8 Frames (4:41)

Key Ideas

As this video progresses, key ideas will be introduced to invoke discussion.

Purpose

The purpose of this video is to help you to filter what you are learning about the Cold War and decolonization through the three frames of the course. Each frame should give you a sense of these connected trends from a different angle. This information can help you to evaluate the three frame narratives for this unit, as well as provide additional evidence to understand how these two global conflicts interlinked.

Process

Preview – Skimming for Gist

As a reminder, open and skim the transcript, and read the questions before you watch the video.

Key Ideas – Understanding Content

Think about the following questions as you watch this video:

  1. What were the systems of production and distribution championed by the United States and the Soviet Union, respectively?
  2. What was a shared trait of capitalism and communism and how did it draw the United States and the Soviet Union into decolonization conflicts?
  3. How can we view decolonization through the lens of the communities frame?
  4. How did the Cold War and decolonization together give rise to networks of leaders, rebels, and states?

Evaluating and Corroborating

  1. This unit focuses on how the Cold War and decolonization were two connected trends. How does looking at these events through the three frames help you to address that idea?

Activity

Geography – Unit 8 Mapping Part 1

Preparation

Activity
Visual Aid
Visual Aid

Purpose

The Second World War ended in 1945, and the victorious allies reforged the world—creating the United Nations in the hope of never repeating the horrors they had just experienced. But the world had not seen the end of global conflict. Not long after the war ended, the United States and the Soviet Union faced off in the global conflict of the Cold War. At the same time, colonized peoples around the world began asserting their own independence in a process called decolonization. In this unit, you will explore the ways that these conflicts were entangled. In this mapping exercise you will identify several states and colonies as they emerged from the peace process in 1945 and make some predictions about how things will change in the decades that followed.

Process

You’ll begin this activity by identifying several states and empires in the world of 1945, after the post-war peace process. You will locate these communities on a blank map and then make some guesses and predictions about how they will change in the decades that follow.

Step 1

Remember, this activity is intended to introduce you to geography in this unit. You aren’t expected to have all the answers.

With your teacher, brainstorm some of the ways the end of World War II changed global politics. Who emerged strongest from the war? Which parts of the world were weaker? How did the war change the relationship between empires and their colonies?

Step 2

In small groups, identify the 10 states listed and also select one empire from the list of empires. You should then shade in all the territory controlled by that empire in 1945 on the blank map.

Step 3

Examine the 1945 Blank Map that you just labelled and the 1945 Political Map. Make two predictions by further annotating your blank map. You should shade in one color all the countries that you think will join the American side of the Cold War and in another all the countries that you think will join the Soviet side. Next, you should place an X on five colonies that you think will gain independence by 1960 and a circle in five colonies you think will gain independence between 1960 and 1975.

Activity

Vocab – Tracking 8.0

Preparation

Vocab Activity

Purpose

This repeated activity should help you become familiar with a process for understanding unfamiliar words anytime you encounter them in the course.

Process

Take out your vocab tracker and be sure to record new and unfamiliar words on it according to your teacher’s instructions.

Activity

Vocab – Word Wall 8.0

Preparation

Vocab Activity
Activity
Activity

Purpose

Understanding vocabulary helps you access course content, become a better reader, and a better communicator. This word wall activity will help you begin to learn some of the key vocabulary from Unit 8.

Process

In this activity, you’ll work with your class to create a word wall using the Unit 8 vocabulary.

Your teacher will assign a vocab card to each of you. Once you get yours, take a few minutes to look it up in the Unit 8 Vocab Guide and then examine the unit itself (click around and quickly skim the content) to see where in the unit your word might be most applicable. Then, add as many antonyms to your card for your word as possible. Your teacher will give you a limited amount of time to write antonyms. Then, the people with the most correct antonyms will put their words on the word wall first.

Your teacher may add some fun twists to this assignment, so be sure to listen closely for directions!

Activity

UP Notebook

Preparation

Activity

Purpose

Each unit of the WHP course is guided by a Unit Problem. You’re learning a ton of stuff in this and every other unit, and it can be hard to keep track of what’s most important. It would be pretty easy to become obsessed with a detail that, although interesting and a great way to impress people at a party is relatively unimportant. This activity will help you stay focused! You’ll think about the Unit Problems, and then you’ll respond to them in writing. By keeping track of how your thinking changes throughout each unit, you’ll see how much you’re learning as you move through each section of the course.

Process

Use the Unit 8 Problem Notebook Worksheet to respond to the prompts as best as you can. Be prepared to talk about your ideas with your class.

Article

Data Exploration: Global Inequality

Preparation

Article
Activity

Open these three charts in your internet browser:

Summary

Though incomes have improved for many people around the world in the last century, inequality between nations and people remains a feature of our world. Economists and historians often talk about the transition from a “two-hump” to a “one-hump” world. As more and more people escape extreme poverty, inequality might be declining. However, the ways in which we present data on inequality can drastically change the way we perceive it. Is inequality really falling? How should we measure inequality?

Purpose

People create charts, and they make decisions about how to display data. Slight changes in variables, range, or presentation can entirely change the meaning of a chart, even when two charts are created by the same person using the exact same data. This is an important part of data literacy, and if you learn to notice these choices, you will be one step closer to understanding how to evaluate the arguments contained in charts. The charts in this exploration will help you identify at least one way that data can be skewed to change meaning.

Process

Your teacher will let you know if there is an overall question to hold in your mind as complete your three reads of the article.

Preview – What Do We Have?

Fill out the Read 1: Preview section of the Three Close Reads for Data worksheet as you complete your first close read. Remember—this should be a quick process!

Key Ideas – What do we know?

For this read, your goal is to understand the “story” the chart is telling by identifying its arguments and evaluating its presentation of data. You will decide what claim or claims this chart is making and what evidence is being used to support those claims. Do you think the data is reliable? Is the chart misleading in any way? By the end of this read, you should be able to answer the following questions:

  1. How does Chart 1 provide evidence for the argument that inequality is decreasing?
  2. According to Chart 1, which region of the globe has seen the least improvement in income? Which has seen the most improvement?
  3. What are some historical explanations for the shift from a two-hump (1975) to a one-hump (2015) world?
  4. What argument is Chart 2 making? How did the creator of the chart want you to feel about inequality?
  5. Chart 2 and 3 show the exact same data, but Chart 3 is represented differently. The effect is a drastic difference between the two charts. Why do they look so different, and how did the creator of Chart 3 want you to feel about inequality?
  6. Charts 2 and 3 provide an example of how a chart can be skewed to change the way you understand it. Does Chart 1 do something similar? If so, what? What is the effect?

Making Connections – What Does This Tell Us?

The third read is really about why the chart is important, what it can tell us about the past, and how it can help us think about the future. At the end of this read, respond to the following questions:

  1. All three of these charts use the international poverty line of $1.90/day (just under $700/year) as their measurement of people living in extreme poverty. Do you think this is an appropriate measurement for poverty? Does it help us understand inequality? Why or why not?
  2. Using these charts, make one prediction about how income inequality will change in your lifetime. What evidence from the charts supports your prediction? What evidence challenges it?

Activity

Project X – Research

Preparation

Activity

Access the Our World in Data website: https://ourworldindata.org/

Access to the World History Project websites:

Purpose

By now, you have selected a research topic and practiced making predictions using data. In this activity, it’s time for you to start the hard work of collecting and analyzing evidence to support the predictions you will make in your final presentation. You will need evidence to support your prediction and to build a historical narrative about your topic. In addition to providing you with a place to record useful sources, this simple activity can serve as a model for future research projects.

Process

In this activity, you will build an archive of sources from two websites. You will explore the Our World in Data (OWID) website and the WHP website as you search for sources to use in your final project. You will keep a log of your sources and record how you intend to use them in your project. You should continue to add to these lists as you work!

Before beginning this activity, familiarize yourself with the OWID and WHP websites. All of your pieces of evidence from this activity should come from OWID and WHP. However, you may seek out other sources of evidence for your final project. You should spend the most time answering the “What is it?” and “How will you use this chart?” portions of the Project X Final Project—Research worksheet.

If you haven’t already done so, begin by making a prediction about your topic of choice. You are not stuck with the prediction that you make at this point; you can change or update it as you gather more information.

Start on your subtopic page on OWID. Most of the charts you gather should be from your subtopic page; however, you should also explore other, related pages. For example, if you are researching the “Urbanization” subtopic in the “Demographic Change” section, you might also find useful resources in the “Land Use” subtopic in the “Food and Agriculture” section. Identify four charts that you will use as evidence in your final presentation.

Once you have identified your four charts, identify them in the Source column of the Step 1 table of the Project X Final Project—Research worksheet. Use the other two columns of the table to describe the charts and explain how you will use them to support your prediction.

Next, search for articles, videos, or primary sources from the WHP course that are related in some way to your topic and the four charts you have identified.

Once you have identified four WHP sources, fill out the table in Step 2 of the worksheet. In the “How will you use this source?” column, focus on how these sources will help you create a history of your topic to support the prediction you make.

Once you have completed the worksheet, your teacher will divide your class into groups based on the topic you chose. Share your findings with your group, making sure to explain how each source will be used to support your prediction.

Be sure to continue updating this list with new charts and resources you collect from OWID, WHP, and elsewhere.