6.0 Unit 6 Overview
- 2 Videos
- 2 Articles
- 8 Activities
- 2 Visual Aids
- 2 Vocab Activities
Introduction
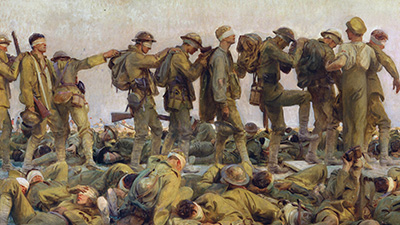
Those witnessing the devastation of the First World War must have thought it a sure bet no country would ever want to go to war again, leading to the name “The War to End All Wars.” At the time, it was the worst and most violent conflict in human history. But, it was only the worst up to that point. Later in this unit you’ll think about why the fighting didn’t stop. In this first lesson, you’ll consider how we humans reached a point in our thinking, and in our technology, that made a “world” war a possibility.
Learning Objectives
- Understand how historical events and processes of the long nineteenth century contributed to the First World War.
- Discover how World War I was the first global and total war.
- Use the historical thinking practice of continuity and change over time across units.
- Learn how to read charts and interpret historical data.
Unit 6 Overview
- combatant
- diplomacy
- disillusion
- imperialism
- Industrial Revolution
- revolution
- total war
Summary
The First World War was not a reversal of the trends of the long nineteenth century, but rather their product. Nationalism, industrialization, capitalism, and the system of great empires all helped to cause the war and its immense suffering. But the massive impact of the war created cracks in this system. Some of these changes—like the emergence of communism in Russia—would happen almost immediately. Others—like the decline of formal overseas empires—would take decades to develop. Was the war a symptom of change, or its cause?
Unit 6 Overview Video (10:10)
Key Ideas
Purpose
The Unit 6 Problem asks you to consider whether or how the First World War was a result of all of the trends we studied in the last four units, and also to predict how the war might set the stage for the century to come. This overview video provides you with your first evidence for responding to both parts of the problem.
Process
Preview – Skimming for Gist
As a reminder, open and skim the transcript, and read the questions before you watch the video.
Key Ideas – Understanding Content
Think about the following questions as you watch this video:
- What were important achievements of the long nineteenth century? What limited these achievements?
- How did the First World War change the global power situation, according to the video?
- What is some quantitative evidence that the First world War is a total war, according to the video?
- What major event happened in St. Petersburg, and how did it impact all of Russia? How was this a result of the First World War?
Evaluating and Corroborating
- Would you consider the First World War a threshold event (in other words, a period of enormous change) in world history? Why or why not?
- This video suggests that some people believed the long nineteenth century to be an era of progress, until the First World War happened. Based on what you learned in previous units, do you agree that the long nineteenth century was an era of progress? Why or why not?
Unit 6 Overview: World War I
- continuity
- disillusion
- nationalism
- threshold
- upheaval
Preparation
Summary
The soldiers and sailors who fought in the First World War had many motives. Some of them wanted to be there, at least at first. Others did not. Similarly, the war itself had many causes. Many of them were European, but others were very global. The impact of the war was enormous. It did create some opportunities, but it created many more lasting wounds that took generations to heal, if they ever really did. Some of those wounds may have helped to cause a second global war, just twenty years later.
Purpose
This overview article will introduce you to the two halves of the Unit 6 Problem: In what ways was the First World War the result of changes that occurred in the long nineteenth century? Should we see it as a threshold event in world history? In considering the First World War as a ‘threshold’ event, or an episode of great change, it asks you to look at the origins of the war and its impact. The whole unit is similarly designed around these two questions—the origins and the impact of the war.
Process
Preview – Skimming for Gist
Fill out the Skimming section of the Three Close Reads worksheet as you complete your first close read. As a reminder, this should be a quick process!
Key Ideas – Understanding Content
For this reading, you should be looking for unfamiliar vocabulary words, the major claim and key supporting details, and analysis and evidence. By the end of the second close read, you should be able to answer the following questions:
- What is the meaning of the last line of Wilfred Owen’s famous poem, which goes like this: “The old lie: Dulce et decorum est pro patria mori”? How does it demonstrate Owen’s perspective of the war?
- What seem to be some explanations for the origins and spread of the First World War, according to the article?
- What hope did Woodrow Wilson and Ho Chi Minh share at the end of the First World War?
- What problems or challenges did the war seemingly create?
Evaluating and Corroborating
At the end of the third close read, respond to the following questions:
- What evidence does this article give for why we might call this conflict a world war? In what ways does it seem that it was global?
Frames in Unit 6
- communism
- era
- ethnic
- threshold
- total war
Summary
The First World War is often described as a threshold event, a moment of decisive change. Was it? Some empires broke up, but others did not, and some even expanded. New states were created, and many people’s attitudes towards the state changed in some ways. It was the first economic ‘total war’, but the global economic system didn’t really change. So was it a real transformation or just a brief blip that interrupted the human story?
Frames in Unit 6 (3:40)
Key Ideas
Purpose
The purpose of this video is to help you to filter what you are learning about the First World War through the three frames of the course. Each frame should give you a sense of the world from the perspectives of this conflict – the changes it caused, and the limits of those changes. This information should help you to evaluate the frame narrative you have been given for this unit.
Process
Preview – Skimming for Gist
As a reminder, open and skim the transcript, and read the questions before you watch the video.
Key Ideas – Understanding Content
Think about the following questions as you watch this video
- How did the First World War cause changes in the way people organized and saw their communities, and how did it not?
- How was the First World War a threshold in terms of production and distribution, and how was it not?
- How did the First World War affect global networks, and what were the limits of that effect?
Evaluating and Corroborating
- Based on the information you have so far, was the First World War a threshold event? Use examples from each of the three frames to support your answer.
Geography – Unit 6 Mapping Part 1
Preparation
Purpose
The long nineteenth century transformed the world. Political revolutions, nationalism, industrialization, imperialism, and social upheaval all sent shockwaves of change through societies in every corner of the world. In 1914, the tensions surrounding many of these changes would send the world to war. In this mapping exercise you will identify some of the participants in the First World War and make predictions about what you think might have caused the war.
Process
You’ll begin this activity by identifying several countries in the world of 1914 CE. You will locate these countries on a blank map and then make some guesses and predictions about how they participated in the war and what changes of the long nineteenth century might have caused the war.
Step 1
Remember, this activity is intended to introduce you to geography in this unit. You aren’t expected to have all the answers.
With your teacher, brainstorm some of the ways that the transformations of the long nineteenth century might have led to the First World War.
Step 2
In small groups, select one of the columns of countries from the table on the worksheet. Label each of the countries on the 1914 Blank Map. When this is complete, each group should share their answers until all 20 countries are labeled on your maps.
Step 3
Examine the 1914 Blank Map you just labelled. Select five of the countries you identified and guess which side of the First World War it fought on (Allied Powers, Central Powers, or Neutral). Next, you should make a prediction of which country you think suffered the highest casualties during the war, including a 1-2 sentence explanation for your prediction. Finally, annotate one part of the map with a transformation of the long nineteenth century that helped cause WWI.
Vocab – Tracking 6.0
Preparation
Purpose
This repeated activity should help you become familiar with a process for understanding unfamiliar words anytime you encounter them in the course.
Process
Take out your vocab tracker and be sure to record new and unfamiliar words on it according to your teacher’s instructions.
Vocab – Word Wall 6.0
Preparation
Purpose
Understanding vocabulary helps you access course content and become a better reader, a better writer, and a better communicator. This word wall activity will help you begin to learn some of the key vocabulary from the unit.
Process
In this activity, you’ll work with your class to create a word wall using the Unit 6 vocabulary.
Your teacher will assign a vocab card to each of you. Once you get yours, take a few minutes to look it up in the Vocab Guide and then examine the unit itself (click around and quickly skim the content) to see where in the unit your word might be most applicable. Then, add as many antonyms to your card for your word as possible. Be careful if you decide to use the “related words” section from the vocab guide – it doesn’t distinguish between synonyms and antonyms. Your teacher will give you a limited amount of time to write antonyms. Then, the people with the most correct antonyms at the end of the time will put their words on the word wall first.
Your teacher may add some fun twists to this assignment, so be sure to listen closely for directions!
UP Notebook
Preparation
Purpose
Each unit of the WHP course is guided by a Unit Problem. You’re learning a ton of stuff in this and every other unit, and it can be hard to keep track of what’s most important. It would be pretty easy to become obsessed with a detail that, although interesting and a great way to impress people at a party is relatively unimportant. This activity will help you stay focused! You’ll think about the Unit Problems, and then you’ll respond to them in writing. By keeping track of how your thinking changes throughout each unit, you’ll see how much you’re learning as you move through each section of the course.
Process
Use the Unit 6 Problem Notebook Worksheet to respond to the prompts as best as you can. Be prepared to talk about your ideas with your class.
Project X – Making a Prediction Part 2
Preparation
Access to the Our World in Data website: https://ourworldindata.org/
Post-it Notes (four colors)
Purpose
In the first Making a Prediction activity, you learned about chart shapes and practiced making and evaluating predictions using a single chart. However, a single piece of evidence is rarely enough to come to an informed conclusion about a topic. This activity will help you learn to make informed predictions using multiple sources of evidence. You will use this skill not only in your final presentation, but also in your life as you navigate decision-making with an ever increasing number of resources at your fingertips.
Process
This activity begins with analyzing a chart with your class. You will then make a prediction about the future of population growth in China, revising your prediction as you are introduced to additional charts. In the final part of this activity, you will repeat this process with a different country.
Step 1
Take a look at the social media platforms chart, (on pg. S-3). Describe what the chart shows and what it tells you about how social media has changed in the last five years. Then, make and share predictions about what social media will look like five years in the future. Be sure to provide evidence from the chart as well as from your own experience with and knowledge of social media. Remember to include the components of a prediction, which you learned in Part 1 of this activity. A prediction includes a reference to a specific year or time frame, a description of the rate and direction of change, the catalyst (or reason for the change), and the end point for the prediction—either an actual number or a percentage.
Step 2
Now it’s time for you to predict whether population in China will go up, go down, or stay the same in the future. Your teacher will mark a scale on the board from 0 to 5 billion people at half-billion increments and organize you in small groups. You will receive four sticky notes, each of a different color. You should use a different color sticky note for your group’s prediction on each chart. Write your names (or a group name) on your four sticky notes.
Take a look at the chart on Chart A (population growth in China), in the Making a Prediction Part 2: Examining China Through Charts handout. Work with your group to complete the table starting on pg. S-4. Use the information to make a prediction how China’s population will change 100 years in the future based on Chart A and any previous knowledge you may have. Show your prediction to the class by placing your next sticky note on the scale from 0 to 5 billion. Be ready to share your prediction.
Now, look at the chart on Chart B (daily supply of calories in China). Work with your group to complete the table. Repeat this same activity with your group based on the new information you have gathered from Chart B. Do this by simply adding your next sticky note to the board. Maybe your prediction will change or maybe not! Be prepared to explain your prediction to the class.
Repeat this same activity two more times using the charts on Chart C (birth rates) and Chart D (extreme poverty), revising your prediction and adding two more sticky notes to the board as you receive new information.
Great! Now let’s put all this information together to finalize your prediction about the future population of China. Write your prediction for the future population of China. Make sure that your prediction includes a time frame (years/date), reasons for the change, an actual population number, and references to the different charts.
Step 3
Next, your teacher will assign your group a country, or have you choose your own. Your teacher might hand out printouts of the same four charts above for your new country, or have you open the interactive charts on computers. If you are viewing the charts on the computer, you will need to click “Add country” on the chart and replace China with your country. You can find links here:
Chart A: https://ourworldindata.org/grapher/population?country=~CHN
Chart B: https://ourworldindata.org/grapher/food-supply-kcal?tab=chart&country=~CHN
Chart C: https://ourworldindata.org/grapher/children-per-woman-un?tab=chart&time=1950..2015&country=~CHN
Chart D: https://ourworldindata.org/grapher/share-of-the-population-living-in-extreme-poverty?tab=chart&country=~CHN
Repeat the same process you used for China with your new country. Look at the same four charts for your new country, making a prediction for what that country’s population will be in 100 years. Do you think the population will go up, down, or stay the same? Adjust your predictions as you come across new evidence. Record the evidence on your worksheet.
Be ready to share and explain your predictions with the class!
Amazing! Now let’s put all this information together to finalize your prediction about the future population of your new country. Write your prediction for the future population of your new country. Make sure that your prediction includes a time frame (years/date), a description of the trend, reasons for the change, an actual population number, and references to the different charts.
Data Exploration: Democracy
Preparation
Open these three charts in your internet browser:
- Chart 1 – Number of Autocracies and Democracies: https://ourworldindata.org/grapher/numbers-of-autocracies-and-democracies
- Charts 2 and 3 – World Citizens Living under Different Political Regimes: https://ourworldindata.org/grapher/world-pop-by-political-regime Political Regime, 1816–2015: https://ourworldindata.org/grapher/political-regime-updated2016
Summary
For most of human history, democracy was pretty rare. Starting in the nineteenth century, this started to change as more democracies emerged from revolutions. During the twentieth century, two world wars, decolonization, and the end of the Cold War all helped propel democratic governments to power. Today, more people live in democracies than not, and most governments in the world are democratic. However, this transition to majority democracies only happened very recently.
Purpose
What are the limits of data? What kinds of things can we use data to measure? In this data exploration, you will encounter three charts that apply numeric values to a pretty fluid social concept: democracy. Is it useful to quantitatively measure something like democracy? What does this sort of data tell us about the history of the spread of democracy? What does it leave out or make it difficult to see? The charts in this data exploration will provide you with evidence to respond to these questions and evaluate the uses to which data is put.
Process
Your teacher will let you know if there is an overall question to hold in your mind as complete your three reads of the article.
Preview – What Do We Have?
Fill out the Read 1: Preview section of the Three Close Reads for Data worksheet as you complete your first close read. Remember—this should be a quick process!
Key Ideas – What Do We Know?
For this read, your goal is to understand the “story” the chart is telling by identifying its arguments and evaluating its presentation of data. You will decide what claim or claims this chart is making and what evidence is being used to support those claims. Do you think the data is reliable? Is the chart misleading in any way? By the end of this read, you should be able to answer the following questions:
- How are Charts 1 and 2 different?
- According to Charts 1, 2, and 3, when did the transition to most of the world living under democratic governments take place? What events might have contributed to this change?
- Were there any points in history when democracies declined for a sustained period? What caused the drop?
- According to Chart 3, which parts of the world were the most democratic, historically? Which are the most democratic today?
- Do you trust this data? Is there anything that this chart leaves out? Do you see any problems with assigning a “democracy score”?
Making Connections – What Does This Tell Us?
The third read is really about why the chart is important, what it can tell us about the past, and how it can help us think about the future. At the end of this read, respond to the following questions:
- Why do these charts matter? What do they tell us about the history and future of human communities and governance? Is our current democratic moment just a blip in a long history of autocracy?
- Using these charts, make one prediction about how democracy will change in your lifetime. What evidence from the charts supports your prediction? What evidence challenges it?