3.0 Era 3 Overview
-
2 Videos
-
2 Articles
-
7 Activities
-
3 Visual Aids
-
2 Vocab Activities
Update ahead! This course will be updated soon. See what's changing.
Introduction
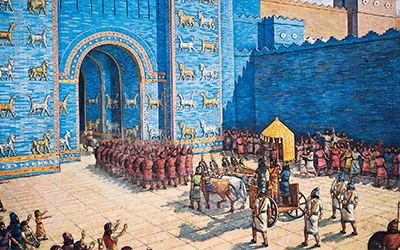
Once we started producing our own food instead of foraging for it, we produced quite a few other things that had not seemed possible—or even seemed to matter—before. Villages, cities, and empires all grew out of the wants and needs that agrarian living created. We will continue to ask if this type of progress truly improved humanity, or just made for a lot more humanity. Our frames enable us to see how some communities grew into states, and some states became empires. Case studies from around the world shows us different ways this could happen. We’ll also look at how these states developed methods of production and distribution, and how networks allowed belief systems to become portable and spread to different regions.
Learning Objectives
- Understand how historians create narratives to tell the story of the formation of cities, societies, and empires.
- Evaluate and analyze the historical narrative about the formation of complex human societies.
- Learn how to read charts and interpret historical data.
Era 3 Overview
Vocab Terms:
- disconnected
- forage
- pollution
- specialist
- sustain
- urbanized
Summary
Era 3 was a period of great change and innovation. In many places, the development of farming contributed to new types of communities and long-distance networks. But we don't entirely understand how (or even where and when) these changes happened. We can begin to explore these transformations through two pieces of evidence: a case study of Tapajos in the Amazon rainforest, and data on the emergence of cities around the world.
Era 3 Overview Video (9:39)
Key Ideas
Purpose
This video introduces you to several important transformations in humans and our societies that began during Era 3. These include new communities—villages, cities, states, empires, and portable congregational religions, as well as expanding networks. These are the changes you will evaluate in responding to the Era Problem: How did new complex societies develop and what was their impact on humans both inside and outside these communities?
Process
Preview – Skimming for Gist
As a reminder, open and skim the transcript, and read the questions before you watch the video.
Key Ideas – Understanding Content
Think about the following questions as you watch this video
- This video begins by looking at the world in 6000 BCE and 700 CE. What does it argue had changed in between these years?
- Why is the Amazon a surprising place to start an era that focuses on cities, states, and long-distance trade networks? According to the video, what was happening in Tapajos after 350 BCE?
- Watch the animation showing the development of cities around the world. This map may not be complete—we may still find more evidence of other cities – but in general, what kind of pattern does it show about where cities emerged first, and then later?
- According to the video, why did the rise of cities lead to the rise of the state?
- According to the video, what was the pattern by which networks of trade grew in this period? How did this help lead to changes in religion?
- What were some of the disadvantages of living in a city and a state at this time?
Evaluating and Corroborating
- The population and age of Tapajos—and whether it should be considered a city—is still disputed. What kind of evidence could be used to figure these things out?
- Do you think the developments of this era should be considered progress? Why or why not?
Era 3 Overview: Cities, Societies, and Empires
Vocab Terms:
- domesticate
- hierarchy
- merchant
- Neolithic
- population density
- society
- state
Preparation


Summary
As foragers became pastoralists and farmers, they also became village dwellers and city-builders. They built larger and larger trading networks. People living in these societies, either by choice or by force, then constructed governments and systems of religion. These systems were constructed to help manage the problems—and opportunities—of bigger populations and more complex life-styles.
Purpose
This overview will introduce you to transformations in the networks, community, and production and distribution frames that took place in this era. Viewed through these three frames, these changes will help you answer the Era Problem: How did new complex societies develop and what was their impact on humans both inside and outside these communities?
Process
Preview – Skimming for Gist
Fill out the Skimming section of the Three Close Reads worksheet as you complete your first close read. As a reminder, this should be a quick process!
Key Ideas – Understanding Content
In this read, students should be paying attention to the information that most helps them understand the article. To do this, students should be looking for unfamiliar vocabulary words, the major claim and key supporting details, and analysis and evidence. By the end of the second close read, students should be able to answer the following questions:
- According to the authors, what are two ways innovation happens?
- What is an empire, according to the article?
- What were some technologies, developed in this period, that helped long-distance travel and trade networks emerge?
- How were cities different from foraging societies in terms of social systems?
- Within these social systems, who did writing serve first, and how?
Evaluating and Corroborating
At the end of the third close read, respond to the following questions:
- Given what you have learned so far, can you make a list of the topics and transformations you think you will learn about in this era?
Frames in Era 3
Vocab Terms:
- communal
- distribute
- govern
- nomadic
- portable
- specialist
Summary
The communities frame is a useful one for viewing developments in Era 3. The spread of village life and the development of cities made it necessary for humans to come up with new ways of governing ourselves. In many regions, that led to states and even empires. Our ancestors also found new ways of explaining and understanding the world around them through the development of belief and ethics systems that were portable and could spread widely. Viewed through different lenses, these same changes also affected production and distribution and networks.
Frames in Era 3 (4:58)
Key Ideas
Purpose
The purpose of this video is to view the big transformations in Era 3—villages, cities, states, empires, long-distance trade, and portable congregational religions—through the three frames of the course. In particular, this video focuses on helping you to understand these changes through the communities frame.
Process
Preview – Skimming for Gist
As a reminder, open and skim the transcript, and read the questions before you watch the video.
Key Ideas – Understanding Content
Think about the following questions as you watch this video:
- How, according to this video, do village-based societies differ from earlier forms of community?
- Why, according to the video, did cities need even more governance?
- What is a state?
- What was new about portable, congregational religions and ethical systems in this era?
- What do these changes look like when viewed through the lens of the networks frame?
Evaluating and Corroborating
- The video ends by stating that the increasing size of networks and larger communities meant that people had access to more goods and services. Then it asks, “was this true for everyone?” How would you go about finding evidence to answer that question?
Geography – Era 3 Mapping Part 1
Preparation


Purpose
We cover a lot of ground in Era 3. Both geographically and chronologically. In 6000 BCE, there were no cities, states, or long-distance trade. By the end of this unit, in 700 CE, complex societies, large cities, major empires, and regional trade routes had emerged across the world. Names that you might recognize, like Persia, Rome, and Athens start to appear. The purpose of this activity is to introduce you to some of the many states and other communities that you will encounter in this era and to begin thinking about why these complex societies developed and how they impacted human communities. The focus of this activity is on the task of identifying and predicting with maps. As the opening map activity for this era, this is intended to help orient you in time and space as you begin to explore this unit.
Process
You begin this activity by identifying several ancient communities that you’ll encounter in Era 3. You will locate these communities on a blank map and then make some guesses and predictions about complex societies in Era 3.
Step 1
With your teacher, brainstorm some factors that might have led to the development of complex societies. How did the development of these societies change life for humans living in them? What are some factors that you think might have influenced the rise of complex societies in some places but not in others during this era? Your teacher may add some factors you haven’t thought about.
Step 2
In small groups, you should select one “ancient communities” and one “cities” column from the table and label the four units in each of your chosen columns on the blank map (eight labels total). When this is complete, each group should share their answers until all 40 features are labeled on your map.
Step 3
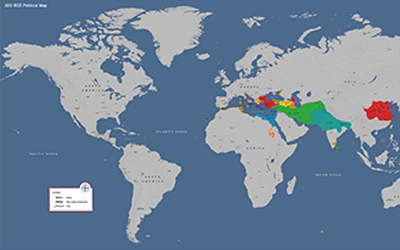
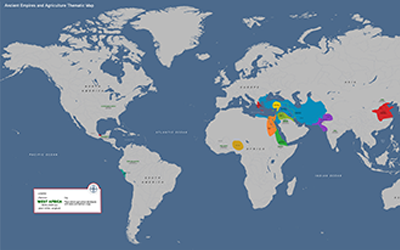
Now examine the 300 BCE Political Map and the Ancient Empires and Agriculture Thematic Map. Choose two communities you just identified and make a guess about why complex societies developed in those places. Finally, draw some predictions on your map, tracing the routes where you think major trade routes will emerge in this unit.
EP Notebook
Preparation

Purpose
Each era of the WHP course is guided by an Era Problem. You’re learning a ton of stuff in this and every other era, and it can be hard to keep track of what’s most important. It would be pretty easy to become obsessed with a detail that, although interesting and a great way to impress people at a party, is relatively unimportant. This activity will help you stay focused! You’ll think about the Era Problems, and then you’ll respond to questions about them in writing. By keeping track of how your thinking changes throughout each era, you’ll see how much you’re learning as you move through each section of the course.
Process
Use the Era 3 Problem Notebook Worksheet to respond to the prompts as best as you can. Be prepared to talk about your ideas with your class.
Vocab – Tracking 3.0
Preparation


Purpose
This repeated activity should help you become familiar with a process for understanding unfamiliar words anytime you encounter them in the course.
Process
Take out your vocab tracker and be sure to record new and unfamiliar words on it according to your teacher’s instructions.
Vocab – Word Wall 3.0
Preparation


Purpose
Understanding vocabulary is integral to you being able to access course content, and it helps reading comprehension, too. This word wall activity should help you begin to learn some of the key vocabulary from Era 3.
Process
In this activity, you’ll work with your class to create a word wall using the Era 3 vocabulary.
Your teacher will assign a vocab card to each of you. Once you get yours, take a few minutes to look it up in the Era 3 Vocab Guide and then examine the era itself (click around and quickly skim the content) to see where in the era your word might be most applicable. Then, add as many synonyms to your card for your word as possible. Your teacher will give you a limited amount of time to write synonyms. Then, the people with the most correct synonyms at the end of that time will put their words on the word wall first.
Your teacher may add some fun twists to this assignment, so be sure to listen closely for directions!
Project X – Making a Prediction Part 1
Preparation

Purpose
This activity is the first of two designed to guide you through the steps of making predictions with data. The following process will help you learn to identify the shapes of graphs and give you some practice with predictions. Evaluating these sample predictions will provide you with models for coming up with your own in the next Making a Prediction activity. The ability to evaluate data is an important skill—for history class and in life—because it enables us to use and apply the information we encounter in our world every day.
Process
In this three-step activity, you will begin by examining a simple line graph and completing a matching activity. Next, you will evaluate several example predictions about the future of poverty and identify the different components of a prediction.
Step 1
There are two main practices that can help you make predictions using charts. First, you can examine the scale and shape of the chart itself to make predictions about how the shape will change if you extend the scale. Second, you need historical information about the chart’s topic. This information— gained from research besides the chart—will help you predict how the trends on the chart might change or stay the same.
Begin by looking over the Making a Prediction Part 1 worksheet. Look at the “How Funny YouTube Videos Are” chart. Based on the chart, as well as your own experience, predict what the line would look like if the timeline were extended to 8:00 a.m. Draw the extended graph. Be prepared to explain why your prediction is correct.
Step 2
Your teacher will place you into small groups to work on Step 2 of the Making a Prediction Part 1 worksheet. With your group, match the graph shapes with the given descriptions. (Note: Some descriptions match more than one chart.) Be prepared to share your responses with the class.
Step 3
Remain in your group to complete Step 3 of the Making a Prediction Part 1 worksheet, which shows a line graph as well as several predictions based on it.
With your group, evaluate the given predictions about the future of poverty. Identify and cross out any predictions you think are very unlikely to occur. Discuss and vote on which of the remaining predictions you think is most likely to take place. Next, work with your group to complete the three discussion questions and your explanations.
Data Exploration: Urbanization
Preparation


Open the following charts in your internet browser:
- Chart 1 – Urban Area Over the Long Term: https://ourworldindata.org/grapher/urban-area-long-term
- Chart 2 – Urbanization over the Past 500 years: https://ourworldindata.org/grapher/urbanization-last-500-years
- Chart 3 – Land Use over the Long Term: https://ourworldindata.org/grapher/land-use-over-the-long-term
- Chart 4 – Urban Population vs. GDP: https://ourworldindata.org/grapher/urbanization-vs-gdp?time=
Summary
Today, more than half of the humans on this planet live in cities. Yet for almost all human history, the vast majority of people lived outside of cities. As more and more humans moved into cities, urbanization gradually changed the ways we lived. After 1800, these changes intensified as urbanization accelerated. Even with over half of all humans living in cities, the “built environment” of urban landscapes is only a small percentage of Earth’s surface. But urbanization’s reach extends beyond cities, affecting how we produce food and the relative wealth of nations.
Purpose
The first data exploration introduced one chart. This second exploration has four. Wow, that escalated quickly... kinda like urbanization! One chart rarely tells the whole story. That’s why it’s important for you to learn how to make connections between different types of data and different charts. Together, the charts in this article will introduce you to changes in urbanization at the global, regional, and national levels. They will also provide you with evidence to evaluate and make claims about urbanization’s impacts on human networks and systems of production and distribution.
Process
Your teacher will let you know if there is an overall question to hold in your mind as complete your three reads of the article.
Preview – What Do We Have?
Fill out the Read 1: Preview section of the Three Close Reads for Data worksheet as you complete your first close read. Remember—this should be a quick process!
Key Ideas – What Do We Know?
For this read, your goal is to understand the “story” the chart is telling by identifying its arguments and evaluating its presentation of data. You will decide what claim or claims this chart is making and what evidence is being used to support those claims. Do you think the data is reliable? Is the chart misleading in any way? By the end of this read, you should be able to answer the following questions:
- How has urbanization changed in the last 12,000 years?
- How are Charts 1 and 2 different?
- What does Chart 3 tell us about the impacts of urbanization on human use of the land?
- What does Chart 4 suggest about the relationship between urbanization and wealth?
- Thinking back to the “ice cream and violent crime” chart from “A Guide to Reading Charts,” can you think of any problems with Chart 4? Can you think of any other variables (like weather in the ice cream chart) that might explain both high levels of urbanization and wealth?
Making Connections – What Does This Tell Us?
The third read is really about why the chart is important, what it can tell us about the past, and how it can help us think about the future. At the end of this read, respond to the following questions:
- What are the connections between these four charts? Together, what do they tell us about urbanization in the long term of human history? What do they tell us about the more recent past?
- Using these four charts, make one prediction about how urbanization will change in your lifetime. What evidence from the charts supports your prediction? What evidence challenges it?