6.0 Unit 6 Overview

  • 2 Videos
  • 2 Articles
  • 8 Activities
  • 2 Visual Aids
  • 2 Vocab Activities

Cookie Policy

Our website uses cookies to understand content and feature usage to drive site improvements over time. To learn more, review our Terms of Use and Privacy Policy.

Introduction

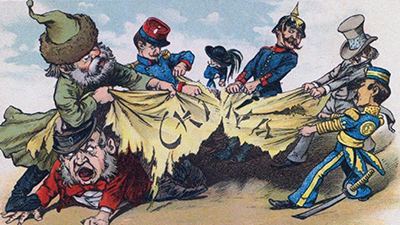
The term “empire” might make you think of Rome or Star Wars. But empires were neither purely ancient nor mainly fictional. Empires go back over 4,000 years. Yet empire was by no means a thing of the past. New ideas about social and political life, plus new technologies for producing and distributing goods to a rapidly growing population, turned much of the world into a competitive arena for resource-hungry industrialized states. The desire for raw materials and cheap labor led to violent conquests that exploited and often dehumanized local people. These populations tried to find ways to resist or shape empire to their own needs, but it was a difficult fight against the powerful. How empires were run, and how they were resisted, left a legacy on today’s world.

Learning Objectives

  1. Identify how industrialization led to imperialism and the expansion of empires.
  2. Learn about the difference between imperialism and colonialism.
  3. Examine the ways in which colonialism directly impacted societies and continues to do so today.
  4. Understand how communities responded to increased industrialization and the expansion of empires.
  5. Learn how to read charts and interpret historical data.
Video

Unit 6 Overview

Vocab Terms:
  • colonialism
  • colony
  • empire
  • exploitative
  • imperialism

Summary

All of the new ideas and advances of the long nineteenth century had their limits or their dark sides. We see that especially in the rise of empires, many of which were ruled by new and seemingly democratic nation-states. These industrial powers competed for new colonies overseas and created wide networks that exploited these colonies for profit. The result was a growing inequality in global income and experiences.

Unit 6 Overview Video (10:49)

Key Ideas

As this video progresses, key ideas will be introduced to invoke discussion.

Purpose

How were industrial empires created and contested, and how did those processes shape our world today? This is the question you will explore in Unit 6. This video will introduce you to that question and provide you with your first evidence to answer that question, as you learn about empires as part of a global system that also included democratization, industrialization, and reformism.

Process

Preview – Skimming for Gist

As a reminder, open and skim the transcript, and read the questions before you watch the video.

Key Ideas – Understanding Content

Think about the following questions as you watch this video:

  1. According to this video, how were the empires of this period different from earlier empires?
  2. How does this video describe “empire”? What is ironic about the fact that Britain, France, Germany, Japan, and the United States held empires in this period?
  3. How does this video define imperialism? How does it define colonialism? How are they connected?
  4. What changes in global economic equality are shown between 1800 and 1975?
  5. How did the French change Hanoi? How did the inhabitants respond?

Evaluating and Corroborating

  1. How can it be possible for a state to both be internally democratic, and have an empire at the same time?
  2. Does the evidence for global income distribution across the period 1800–1975 prove that empires were responsible for growing inequality between regions? Why or why not?

Article

Unit 6 Overview: Empire and other Consequences of Industrialization 1850 to 1950

Vocab Terms:
  • colonialism
  • empire
  • imperialism
  • nation-state
  • racism
  • subject

Preparation

Activity

Summary

Empires had existed before the long nineteenth century. However, in this era, they became massive, fueled by trends you have read about including industrialization, nationalism, science, capitalism, and even reformism. These ideas combined in some countries to create imperialism—a belief in the destiny to rule an empire. The result were colonies, and colonialism. But many people didn’t want to be colonized, and they found strategies to respond—whether by actively resisting, or adapting, or just trying to survive and thrive in difficult circumstances.

Purpose

This overview article introduces you to Unit 6. It will explore the two, connected parts of modern empires—the development of imperialism in industrialized societies, and the operation of colonialism in the imperial periphery. It also describes some of the strategies of people living under colonial rule. This overview will provide you with a better understanding of how industrial empires fit into the three course frames.

Process

Preview – Skimming for Gist

Fill out the Skimming for Gist section of the Three Close Reads worksheet as you complete your first close read. As a reminder, this should be a quick process!

Key Ideas – Understanding Content

For this reading, you should be looking for unfamiliar vocabulary words, the major claim and key supporting details, and analysis and evidence. By the end of the second close read, you should be able to answer the following questions:

  1. How did reformers actually drive imperialism, in some cases?
  2. How did imperial claims of racial superiority affect people in colonies?
  3. Why did industrialization help to support imperialism?
  4. What does it mean to say that people in the colonies were “subjects”?
  5. How, according to the article, did colonial subjects respond to being treated this way?
  6. What happened to these large, formal empires in the end?

Evaluating and Corroborating

For the third close read, you should think about how the article relates to the idea or question you thought about as you read.

At the end of the third close read, respond to the following questions:

  1. The author of this article asks: “Was empire really just a dead end, or does a version of it persist today?” Having read this article, how would you answer? Explain your reasoning.

Video

Unit 6 Frames

Summary

The rise of industrialized empires in the long nineteenth century seems to contradict the stories we have told so far through all three frames. Wasn’t political liberalism supposed to end empire and bring political equality? Wasn’t the Industrial Revolution supposed to promote free labor? Weren’t reformers fighting to end inequality? Unit 6 asks students to use all three frames to better understand the changes of the long nineteenth century and how they produced uneven results for different people. In turn, this will help students think about how these inequalities persist in the present.

Unit 6 Frames (5:17)

Key Ideas

As this video progresses, key ideas will be introduced to invoke discussion.

Purpose

This video uses the three frames of the course to help you explore the new age of empires that arose as a result of industrialization. Each frame gives you a sense of the world from the perspectives of empires—as unbalanced webs of production and distribution, as unequal communities, and as places that didn’t quite fit into networks of reform. This information can help you to evaluate the frame narratives for this unit, as well as providing additional evidence to understand the lasting impacts of the changes that took place.

Process

Preview – Skimming for Gist

As a reminder, open and skim the transcript, and read the questions before you watch the video.

Key Ideas – Understanding Content

Think about the following questions as you watch this video:

  1. The long nineteenth century gave rise to nation-states with individual sovereignty and political participation. How did empires contradict that trend?
  2. The long nineteenth century saw the rise of industrialization. How did empires complicate that trend?
  3. The long nineteenth century saw a network of reform movements arise. Did colonies benefit from this trend?

Evaluating and Corroborating

  1. Empires seem to contradict trends in this period, such as the extension of new political and social rights. Do you think that this was a “feature” of empires (in other words, they were designed to contradict these trends) or a “bug” (in other words, those rights weren’t extended to people in the colonies by mistake)? Explain your answer.

Activity

Geography – Unit 6 Mapping Part 1

Preparation

Activity
Visual Aid
Visual Aid

Purpose

Empires are nothing new—they’ve been around in one form or another for thousands of years. Yet, in the long nineteenth century, new forms and methods of empire emerged. In this unit, you’ll explore the ideas behind the ideology of imperialism and the practices of colonialism (and learn how to tell the difference between the two terms!). From 1750 to 1914, the nature of empire transformed as the most powerful empires in the world industrialized. In this mapping exercise you will identify some of the most powerful states practicing this “new imperialism” and make some predictions about how things will change by the end of the long nineteenth century.

Process

You’ll begin this activity by identifying several empires in the world of 1871 CE. You will locate these communities on a blank map and then make some guesses and predictions about how they will change by the end of the long nineteenth century.

Step 1

Remember, this activity is intended to introduce you to geography in this unit. You aren’t expected to have all the answers.

With your teacher, brainstorm some of the ways that the Industrial Revolution changed empires in the long nineteenth century. What empires benefited the most? Which communities suffered the most? What advantages did the new industrial empires have over their adversaries?

Step 2

In small groups, select three empires from this list on the worksheet. You should then label and shade (in different colors) the territory of each of the three empires on the 1871 Blank Map.

Step 3

Examine the 1871 Blank Map that you just labelled. Select two of the three empires you identified and make a prediction, on your 1871 Blank Map, about how those empires will change between 1871 and 1914.

Activity

Vocab – Tracking 6.0

Preparation

Vocab Activity

Purpose

This repeated activity should help you become familiar with a process for understanding unfamiliar words anytime you encounter them in the course.

Process

Take out your vocab tracker and be sure to record new and unfamiliar words on it according to your teacher’s instructions.

Activity

Vocab – Word Wall 6.0

Preparation

Vocab Activity
Activity
Activity

Purpose

Understanding vocabulary helps you access course content and become a better reader, a better writer, and a better communicator. This word wall activity will help you begin to learn some of the key vocabulary from the unit.

Process

In this activity, you’ll work with your class to create a word wall using the Unit 6 vocabulary.

Your teacher will assign a vocab card to each of you. Once you get yours, take a few minutes to look it up in the Vocab Guide and then examine the unit itself (click around and quickly skim the content) to see where in the unit your word might be most applicable. Then, add as many antonyms to your card for your word as possible. Be careful if you decide to use the “related words” section from the vocab guide – it doesn’t distinguish between synonyms and antonyms. Your teacher will give you a limited amount of time to write antonyms. Then, the people with the most correct antonyms at the end of the time will put their words on the word wall first.

Your teacher may add some fun twists to this assignment, so be sure to listen closely for directions!

Activity

UP Notebook

Preparation

Activity

Purpose

Each unit of the WHP course is guided by a Unit Problem. You’re learning a ton of stuff in this and every other unit, and it can be hard to keep track of what’s most important. It would be pretty easy to become obsessed with a detail that, although interesting and a great way to impress people at a party is relatively unimportant. This activity will help you stay focused! You’ll think about the Unit Problems, and then you’ll respond to them in writing. By keeping track of how your thinking changes throughout each unit, you’ll see how much you’re learning as you move through each section of the course.

Process

Use the Unit 6 Problem Notebook Worksheet to respond to the prompts as best as you can. Be prepared to talk about your ideas with your class.

Activity

Project X – Making a Prediction Part 2

Preparation

Activity
Activity

Access to the Our World in Data website: https://ourworldindata.org/

Post-it Notes (four colors)

Purpose

In the first Making a Prediction activity, you learned about chart shapes and practiced making and evaluating predictions using a single chart. However, a single piece of evidence is rarely enough to come to an informed conclusion about a topic. This activity will help you learn to make informed predictions using multiple sources of evidence. You will use this skill not only in your final presentation, but also in your life as you navigate decision-making with an ever increasing number of resources at your fingertips.

Process

This activity begins with analyzing a chart with your class. You will then make a prediction about the future of population growth in China, revising your prediction as you are introduced to additional charts. In the final part of this activity, you will repeat this process with a different country.

Step 1

Take a look at the social media platforms chart, (on pg. S-3). Describe what the chart shows and what it tells you about how social media has changed in the last five years. Then, make and share predictions about what social media will look like five years in the future. Be sure to provide evidence from the chart as well as from your own experience with and knowledge of social media. Remember to include the components of a prediction, which you learned in Part 1 of this activity. A prediction includes a reference to a specific year or time frame, a description of the rate and direction of change, the catalyst (or reason for the change), and the end point for the prediction—either an actual number or a percentage.

Step 2

Now it’s time for you to predict whether population in China will go up, go down, or stay the same in the future. Your teacher will mark a scale on the board from 0 to 5 billion people at half-billion increments and organize you in small groups. You will receive four sticky notes, each of a different color. You should use a different color sticky note for your group’s prediction on each chart. Write your names (or a group name) on your four sticky notes.

Take a look at the chart on Chart A (population growth in China), in the Making a Prediction Part 2: Examining China Through Charts handout. Work with your group to complete the table starting on pg. S-4. Use the information to make a prediction how China’s population will change 100 years in the future based on Chart A and any previous knowledge you may have. Show your prediction to the class by placing your next sticky note on the scale from 0 to 5 billion. Be ready to share your prediction.

Now, look at the chart on Chart B (daily supply of calories in China). Work with your group to complete the table. Repeat this same activity with your group based on the new information you have gathered from Chart B. Do this by simply adding your next sticky note to the board. Maybe your prediction will change or maybe not! Be prepared to explain your prediction to the class.

Repeat this same activity two more times using the charts on Chart C (birth rates) and Chart D (extreme poverty), revising your prediction and adding two more sticky notes to the board as you receive new information.

Great! Now let’s put all this information together to finalize your prediction about the future population of China. Write your prediction for the future population of China. Make sure that your prediction includes a time frame (years/date), reasons for the change, an actual population number, and references to the different charts.

Step 3

Next, your teacher will assign your group a country, or have you choose your own. Your teacher might hand out printouts of the same four charts above for your new country, or have you open the interactive charts on computers. If you are viewing the charts on the computer, you will need to click “Add country” on the chart and replace China with your country. You can find links here:

Chart A: https://ourworldindata.org/grapher/population?country=~CHN
Chart B: https://ourworldindata.org/grapher/food-supply-kcal?tab=chart&country=~CHN
Chart C: https://ourworldindata.org/grapher/children-per-woman-un?tab=chart&time=1950..2015&country=~CHN
Chart D: https://ourworldindata.org/grapher/share-of-the-population-living-in-extreme-poverty?tab=chart&country=~CHN

Repeat the same process you used for China with your new country. Look at the same four charts for your new country, making a prediction for what that country’s population will be in 100 years. Do you think the population will go up, down, or stay the same? Adjust your predictions as you come across new evidence. Record the evidence on your worksheet.

Be ready to share and explain your predictions with the class!

Amazing! Now let’s put all this information together to finalize your prediction about the future population of your new country. Write your prediction for the future population of your new country. Make sure that your prediction includes a time frame (years/date), a description of the trend, reasons for the change, an actual population number, and references to the different charts.

Article

Data Exploration: Greenhouse Gas Emissions

Preparation

Article
Activity

Open these four charts in your internet browser:

Summary

The average temperature of the planet is rising, and it’s rising because humans are emitting more greenhouse gases (GHGs) into the atmosphere. Since the Industrial Revolution, the global temperature has risen by about 1 degree Celsius. This might not seem like much, but climate scientists warn that an increase of 2 degrees Celsius from pre-industrial levels could be catastrophic. Every region of the world produces more greenhouse gases today than 100 years ago, but some regions produce far more than others. These trends could improve or get worse, but that depends on what actions humans take now and in the future.

Purpose

Is it getting hot in here, or is it just the data? In this data exploration, you’re going to start really thinking about the future. Climate change is one of the most important challenges facing our species. Chart 4 in this exploration provides an example of how to use data to make claims about the future. This chart provides five possible futures of GHG emissions, depending on the actions taken by humans. Which outcome do you think is most likely? This data exploration will help prepare you for your final presentation, in which you will make your own claims about the future using data.

Process

Your teacher will let you know if there is an overall question to hold in your mind as complete your three reads of the article.

Preview – What Do We Have?

Fill out the Skimming section of the Three Close Reads for Data worksheet as you complete your first close read. Remember— this should be a quick process!

Key Ideas – What Do We Know?

For this read, your goal is to understand the “story” the chart is telling by identifying its arguments and evaluating its presentation of data. You will decide what claim or claims this chart is making and what evidence is being used to support those claims. Do you think the data is reliable? Is the chart misleading in any way? By the end of this read, you should be able to answer the following questions:

  1. According to Charts 1 and 2, when did the global average temperature start to rise most dramatically, and what caused it?
  2. Looking at Chart 2, who are the biggest producers of CO2 emissions?
  3. According to Chart 2, who produced most of the world’s CO2 emissions before 1900?
  4. According to Chart 3, what countries produced the most CO2 emissions during the First and Second World Wars? Are there any major countries that you think produced a lot of emissions but are not represented accurately on this map?
  5. Looking at the five possible future scenarios on Chart 4, which do you think is the most likely?
  6. Considering the information on Chart 1 and 4, if all countries act immediately and aggressively to decrease our greenhouse gas emissions, will the global average temperature decrease by 2100?

Making Connections – What Does This Tell Us?

The third read is really about why the chart is important, what it can tell us about the past, and how it can help us think about the future. At the end of this read, respond to the following questions:

  1. Why does this chart matter? What do these charts about average temperature and emissions tell us about the history of human production and distribution? Can data help us change the future?
  2. Using these charts, make one prediction about how global average temperature or greenhouse gas emissions will change in your lifetime. What evidence from the charts supports your prediction? What evidence challenges it?