6.0 Era 6 Overview
-
2 Videos
-
2 Articles
-
7 Activities
-
2 Visual Aids
-
2 Vocab Activities
Update ahead! This course will be updated soon. See what's changing.
Introduction
You’re going to hear and read the world “revolution” a lot in this era. During the “long nineteenth century” revolutions swept the world and built the first nation-states. With the nation-state came the idea that people and nations should govern themselves. But political revolutions weren’t the only revolutions. The Industrial Revolution transformed how humans made and moved the stuff we use. The 164-year “century” between 1750 and the start of World War I transformed how people understood childhood, work, gender, and the very concept of human liberty. Driven by new ideas and new machines, the long nineteenth century created the world we live in today. This overview lesson gets you ready for the fast-moving origin story of modern life.
Learning Objectives
- Understand how historians create narratives to explain the birth of modernity and the effects of the modern world on human communities and networks.
- Evaluate and analyze the historical narrative of the creation of a new age: modernity.
- Learn how to read charts and interpret historical data.
Era 6 Overview
Vocab Terms:
- authoritarian
- capitalist
- citizen
- democratic
- imperialism
- industrial
- nation
Summary
The “long nineteenth century” is a term that describes the period between about 1750 and 1914 (so, much more than a century!). This period saw rapid changes in the way people lived, worked, travelled, produced things, governed themselves, and connected to each other. Some of these changes were conflicting: for example, the rise of empires and nation-states at the same time, or the rise of ideas about liberty and rights alongside with the development of huge inequalities. Together, though, these transformations practically invented the ‘modern world’.
Era 6 Overview Video (10:46)
Key Ideas
Purpose
What were the engines of change that created our “modern” world? This is the Era 6 Problem, and this video will introduce you to that problem with a description of the many changes in the world and the lives of the people who lived in it during this era.
Process
Preview – Skimming for Gist
As a reminder, open and skim the transcript, and read the questions before you watch the video.
Key Ideas – Understanding Content
Think about the following questions as you watch this video:
- What does the video list as features of the modern world that came into existence during this period?
- What were the contradictory political results for the people of Senegal in this period? How did this reflect bigger changes in communities in this period?
- How does this video claim that communities were changing in this period?
- How did the Industrial Revolution change life during Era 6?
- What happened to systems of weights, measures, and qualities in this period?
- What happened to global CO2 emissions during this period?
Evaluating and Corroborating
- In this video, Kim says that “your daily life is a result of these changes”. Given the changes explored in this video, do you agree? Why or why not?
Era 6 Overview: The Long Nineteenth Century
Vocab Terms:
- capitalism
- imperialism
- industrial
- liberal
- nation-state
- revolution
Preparation


Summary
The long nineteenth century was a period of change. We often speak of these changes as being so large and complete that they should be considered revolutions. This era saw new forms of energy, which powered new machines and factories, expanding and conflicting economic systems, more and faster communication, bigger empires, and new political ideals. Lots of new things, but were they all signs of ‘progress.’ And if so, for whom?
Purpose
The long nineteenth century saw so many big transformations that we need to break them down into more manageable bits. This article introduces you to these transformations in four categories: first, liberal political revolutions and nationalism; second, the Industrial Revolution; third, the rise of larger, industrial empires; and fourth, the development of the economic systems of capitalism and socialism. As you learn about these changes, you should be considering how transformative they really were, and for whom.
Process
Preview – Skimming for Gist
Fill out the Skimming section of the Three Close Reads worksheet as you complete your first close read. As a reminder, this should be a quick process!
Key Ideas – Understanding Content
For this reading, you should be looking for unfamiliar vocabulary words, the major claim and key supporting details, and analysis and evidence. By the end of the second close read, you should be able to answer the following questions:
- Why do the authors argue that the length of time covered in Era 6 is both long and short?
- What was the increasingly popular idea that drove the ‘liberal’ revolutions, according to the article?
- What was the first big discovery in the Industrial Revolution, according to the authors?
- How did new, expanding empires support the Industrial Revolution? What result did this have for the people of the colonies?
- What were some of the outcomes of capitalism in this period, according to the authors?
Evaluating and Corroborating
At the end of the third close read, respond to the following question:
- Which of the four revolutions or themes described in this article do you think was most important, and why?
Frames in Era 6
Vocab Terms:
- collapse
- empire
- independent
- liberty
- nation-state
- revolution
Summary
How should we understand the changes that took place over the course of the long nineteenth century? Through the communities frame, as a change in the number, type, and shape of states and the political rights of people? Through the production and distribution frame, as a transformation in how people worked and got the stuff they needed? Or through the networks frame, in terms of increased connections among people? In each case, the world began to look a lot more like it does today.
Frames in Era 6 (4:46)
Key Ideas
Purpose
The purpose of this video is to help you to filter the big transformations of this era through the three frames of the course. Each frame gives us a sense of dramatic change in this era, but using different frames allow us to highlight different aspects of these transformations. This should guide you to support, extend, or contest the long narratives of human history as viewed through these three frames.
Process
Preview – Skimming for Gist
As a reminder, open and skim the transcript, and read the questions before you watch the video.
Key Ideas – Understanding Content
Think about the following questions as you watch this video
- What does the term ‘revolution’ mean, according to the video?
- What were some large changes in this period related to the communities frame?
- What were some large changes in this period related to the networks frame?
- What were some large changes in this period related to the production and distribution frame?
Evaluating and Corroborating
- It would be easy to see the long nineteenth century as a period of ‘progress’ through all three frames. What evidence is there that we shouldn’t view it simply as an era of progress?
Geography – Era 6 Mapping Part 1
Preparation


Purpose
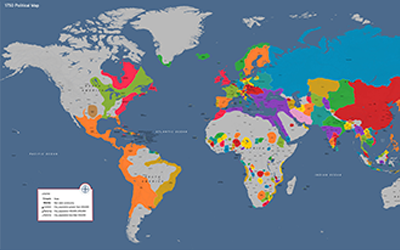
In this course, we explore the period between 1750 and 1914—what is sometimes called the “long nineteenth century”—as an era of great change. In this mapping activity, we’re going to look at political revolutions—big changes in government. Before you start reading about these revolutions later in this era, you might want to make some predictions about the changes you will see. The tool you’ll use for making these predictions is a political map of the world in 1750—a map that shows many of the states that existed in this period and their borders.
Process
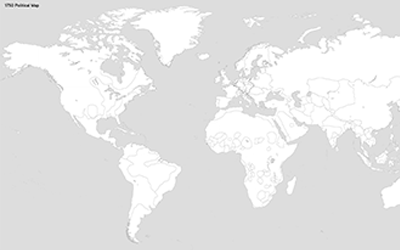
You’ll begin this activity by predicting some factors that might lead to political revolutions. Then, you’ll use a political map to identify some states, including empires, that existed in this period. You’ll annotate a blank map with these identifications. Finally, you’ll use your annotated map to make some predictions.
Step 1
With your teacher, brainstorm some factors that might have led to political revolutions in the long nineteenth century. Why do you think there might have been revolutions in many places during this period? Your teacher may add some factors you haven’t thought about.
Step 2
In small groups, you should select one of the “political units” categories from the table and label the four places listed on the blank map. When this is complete, each group should share their answers until all 20 features are labeled on your map.
Step 3
Now make a prediction about two places where revolutions are likely to happen during the long nineteenth century that follows the period depicted on this map. Remember the factors you discussed earlier. You should annotate the blank map you labelled with those predictions.
Vocab – Tracking 6.0
Preparation


Purpose
This repeated activity should help you become familiar with a process for understanding unfamiliar words anytime you encounter them in the course.
Process
Take out your vocab tracker and be sure to record new and unfamiliar words on it according to your teacher’s instructions.
Vocab – Word Wall 6.0
Preparation


Purpose
Understanding vocabulary helps you access course content and become a better reader, a better writer, and a better communicator. This word wall activity will help you begin to learn some of the key vocabulary from the era.
Process
In this activity, you’ll work with your class to create a word wall using the Era 6 vocabulary.
Your teacher will assign a vocab card to each of you. Once you get yours, take a few minutes to look it up in the Vocab Guide and then examine the era itself (click around and quickly skim the content) to see where in the era your word might be most applicable. Then, add as many antonyms to your card for your word as possible. Be careful if you decide to use the “related words” section from the vocab guide – it doesn’t distinguish between synonyms and antonyms. Your teacher will give you a limited amount of time to write antonyms. Then, the people with the most correct antonyms at the end of the time will put their words on the word wall first.
Your teacher may add some fun twists to this assignment, so be sure to listen closely for directions!
EP Notebook
Preparation

Purpose
Each unit of the WHP course is guided by an Era Problem. You’re learning a ton of stuff in this and every other era, and it can be hard to keep track of what’s most important. It would be pretty easy to become obsessed with a detail that, although interesting and a great way to impress people at a party, is relatively unimportant. This activity will help you stay focused! You’ll think about the Era Problems, and then you’ll respond to questions about them in writing. By keeping track of how your thinking changes throughout each era, you’ll see how much you’re learning as you move through each section of the course.
Process
Use the Era 6 Problem Notebook Worksheet to respond to the prompts as best as you can. Be prepared to talk about your ideas with your class.
Data Exploration: Greenhouse Gas Emissions
Preparation


Open these four charts in your internet browser:
- Chart 1 – Average Temperature Anomaly, Global: https://ourworldindata.org/grapher/temperature-anomaly
- Chart 2 – Annual Total CO2 Emissions by World Region: https://ourworldindata.org/grapher/annual-co-emissions-by-region
- Chart 3 – Annual CO2 Emissions, 2017: https://ourworldindata.org/grapher/annual-co2-emissions-per-country
- Chart 4 – Global Greenhouse Gas Emissions Scenarios: https://ourworldindata.org/uploads/2018/04/Greenhouse-gas-emission-scenarios-01.png
Summary
The average temperature of the planet is rising, and it’s rising because humans are emitting more greenhouse gases (GHGs) into the atmosphere. Since the Industrial Revolution, the global temperature has risen by about 1 degree Celsius. This might not seem like much, but climate scientists warn that an increase of 2 degrees Celsius from pre-industrial levels could be catastrophic. Every region of the world produces more greenhouse gases today than 100 years ago, but some regions produce far more than others. These trends could improve or get worse, but that depends on what actions humans take now and in the future.
Purpose
Is it getting hot in here, or is it just the data? In this data exploration, you’re going to start really thinking about the future. Climate change is one of the most important challenges facing our species. Chart 4 in this exploration provides an example of how to use data to make claims about the future. This chart provides five possible futures of GHG emissions, depending on the actions taken by humans. Which outcome do you think is most likely? This data exploration will help prepare you for your final presentation, in which you will make your own claims about the future using data.
Process
Your teacher will let you know if there is an overall question to hold in your mind as complete your three reads of the article.
Preview – What Do We Have?
Fill out the Skimming section of the Three Close Reads for Data worksheet as you complete your first close read. Remember— this should be a quick process!
Key Ideas – What Do We Know?
For this read, your goal is to understand the “story” the chart is telling by identifying its arguments and evaluating its presentation of data. You will decide what claim or claims this chart is making and what evidence is being used to support those claims. Do you think the data is reliable? Is the chart misleading in any way? By the end of this read, you should be able to answer the following questions:
- According to Charts 1 and 2, when did the global average temperature start to rise most dramatically, and what caused it?
- Looking at Chart 2, who are the biggest producers of CO2 emissions?
- According to Chart 2, who produced most of the world’s CO2 emissions before 1900?
- According to Chart 3, what countries produced the most CO2 emissions during the First and Second World Wars? Are there any major countries that you think produced a lot of emissions but are not represented accurately on this map?
- Looking at the five possible future scenarios on Chart 4, which do you think is the most likely?
- Considering the information on Chart 1 and 4, if all countries act immediately and aggressively to decrease our greenhouse gas emissions, will the global average temperature decrease by 2100?
Making Connections – What Does This Tell Us?
The third read is really about why the chart is important, what it can tell us about the past, and how it can help us think about the future. At the end of this read, respond to the following questions:
- Why does this chart matter? What do these charts about average temperature and emissions tell us about the history of human production and distribution? Can data help us change the future?
- Using these charts, make one prediction about how global average temperature or greenhouse gas emissions will change in your lifetime. What evidence from the charts supports your prediction? What evidence challenges it?
Project X – Research
Preparation

Access the Our World in Data website: https://ourworldindata.org/
Access to the World History Project websites:
Purpose
By now, you have selected a research topic and practiced making predictions using data. In this activity, it’s time for you to start the hard work of collecting and analyzing evidence to support the predictions you will make in your final presentation. You will need evidence to support your prediction and to build a historical narrative about your topic. In addition to providing you with a place to record useful sources, this simple activity can serve as a model for future research projects.
Process
In this activity, you will build an archive of sources from two websites. You will explore the Our World in Data (OWID) website and the WHP website as you search for sources to use in your final project. You will keep a log of your sources and record how you intend to use them in your project. You should continue to add to these lists as you work!
Before beginning this activity, familiarize yourself with the OWID and WHP websites. All of your pieces of evidence from this activity should come from OWID and WHP. However, you may seek out other sources of evidence for your final project. You should spend the most time answering the “What is it?” and “How will you use this chart?” portions of the Project X Final Project—Research worksheet.
If you haven’t already done so, begin by making a prediction about your topic of choice. You are not stuck with the prediction that you make at this point; you can change or update it as you gather more information.
Start on your subtopic page on OWID. Most of the charts you gather should be from your subtopic page; however, you should also explore other, related pages. For example, if you are researching the “Urbanization” subtopic in the “Demographic Change” section, you might also find useful resources in the “Land Use” subtopic in the “Food and Agriculture” section. Identify four charts that you will use as evidence in your final presentation.
Once you have identified your four charts, identify them in the Source column of the Step 1 table of the Project X Final Project—Research worksheet. Use the other two columns of the table to describe the charts and explain how you will use them to support your prediction.
Next, search for articles, videos, or primary sources from the WHP course that are related in some way to your topic and the four charts you have identified.
Once you have identified four WHP sources, fill out the table in Step 2 of the worksheet. In the “How will you use this source?” column, focus on how these sources will help you create a history of your topic to support the prediction you make.
Once you have completed the worksheet, your teacher will divide your class into groups based on the topic you chose. Share your findings with your group, making sure to explain how each source will be used to support your prediction.
Be sure to continue updating this list with new charts and resources you collect from OWID, WHP, and elsewhere.