Data Literacy
 Teaching This Skill

A Guide to Reading Charts
A reference for building the important skill of learning to read and evaluate charts.

Three-Step Reading for Data
This handy tool can be used with any data visualization.

Historical Thinking Skills Guide
Develop the skills needed to analyze and think like a historian.

Data Literacy Strategies
Timelines, maps, and graphs help historians see change over time.
Featured Materials

Climate Impacts: Sea-Level Rise

Data Investigation
Data Investigation: Health

Data Warm-Up

How Do We Know Climate Change Is Real?
Mapping a Climate Future
Data for Understanding our Past and Present
These data explorations cover a wide range of topics, a great fit in any social studies course.
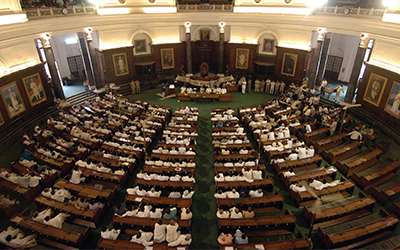
Data Exploration: Democracy
Today, most people in the world live in democracies, and most governments in the world are democratic. The data shows that this transition to democracy happened only recently.

Data Exploration: Population
There are a lot of humans living on the planet today. But for most of our history, our population was much smaller. Demography provides one window into our shared history.

Data Exploration: Urbanization
Most humans live in cities today. Yet for most of our history, this was not the case. The shift to cities is a long story, but it’s one that accelerated quite recently.
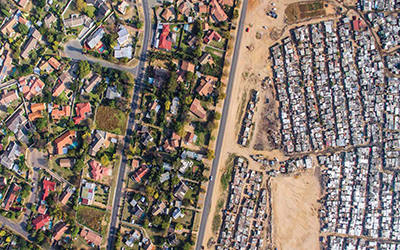
Data Exploration – Global Inequality
Life is getting better for a lot of people, but extreme inequality remains a feature of our world in the twenty-first century. Is income inequality getting better or worse?
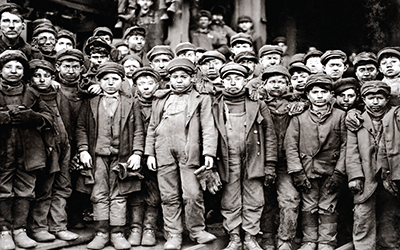
Data Exploration: Child Labor
Children have always worked. During the nineteenth and twentieth century, reform movements sought to limit this, but even today, 265 million children still work.
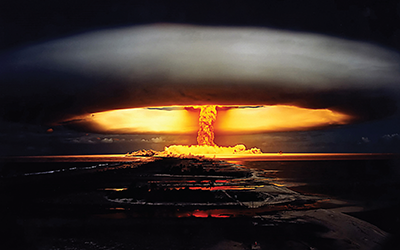
Data Exploration: Nuclear Weapons
After 1945, the superpowers engaged in a race to obtain the most and best nuclear weapons. How should we measure the threat posed by the spread of these weapons?
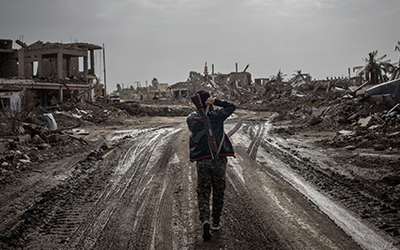
Data Exploration: War and Peace
The past was not peaceful. Is there more violent conflict today than in the past? Is war becoming deadlier? The data is more complicated than you might think.

Data Exploration: Future Population Growth
There are a lot of us living on this planet. But the rate of population growth has slowed in recent decades. Can data help us predict our population future?
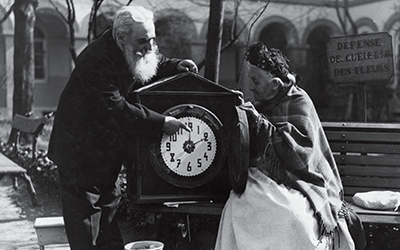
Data Exploration: Life Expectancy
The past was not peaceful. Is there more violent conflict today than in the past? Is war becoming deadlier? The data is more complicated than you might think.
Climate Data Explorations
Explore data to help deepen your understanding of the causes and impacts of climate change.
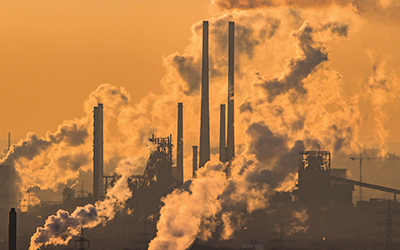
Data Exploration: Greenhouse Gas Emissions
It’s getting hot out there, folks. These charts provide an overview of historic changes in average temperature and greenhouse gas emissions—with an eye toward the future.
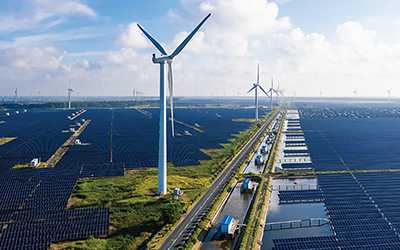
Data Exploration: Renewable Electricity Data Introduction
More and more of the world’s electricity is coming from renewable or low-emission sources. However, when you calculate total energy usage, the fraction from renewables is still very small.

Data Exploration: Plastics Data Introduction
Plastic is everywhere in the world now. Plastic gets a bad reputation because it oftentimes ends up in rivers, lakes, and the ocean, causing pollution and damaging sea life. However, plastic might act as a key ally in the fight against climate change.
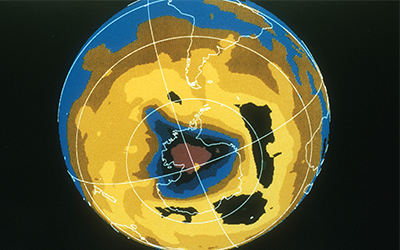
Data Exploration: International Environmental Treaties Data Introduction
Taking action to prevent climate change can seem daunting. But we do have examples of actions that have worked to identify and address environmental problems in the past.
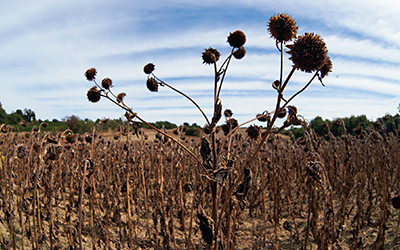
Data Exploration: Food and Climate Change Data Introduction
The food industry must feed billions more people than it did a hundred years ago. In order to understand how the food industry impacts climate change, it’s important to measure what foods are eaten and how many emissions each kind of food contributes.
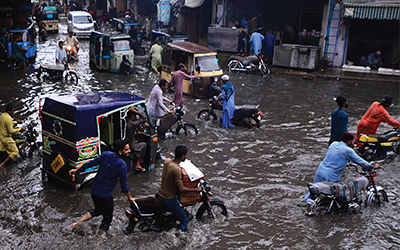
Data Exploration: Climate Inequality Data Introduction
Climate change does not impact everyone in the same way. It hurts the world’s poorest people the most, and the people who will be most impacted by climate change are those who contributed to it the least.
