Geography and Maps
Maps tell the visual story of history. They reflect choices, events, and global shake-ups. Use these classroom-ready teaching resources to help students understand the world and how it changes over time. Explore a full lesson or access a specific map with our map directory.
 How to Teach Geography

Lesson Plan: Maps
In this lesson plan, students consider how maps reflect the priorities of their makers and how maps in turn shape our understanding of the world.

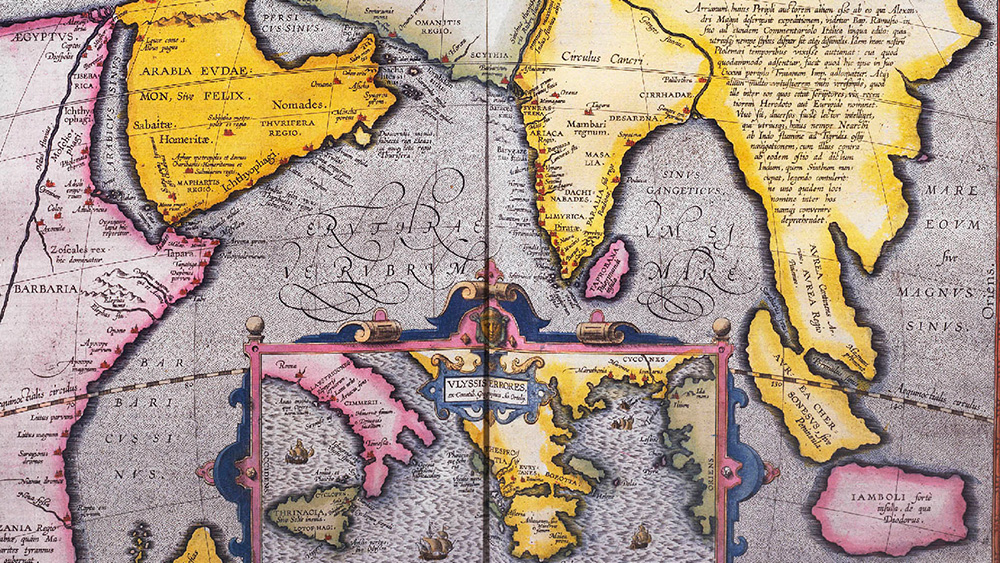
Here be dragons: Teaching world history in maps
How can maps help us understand the worldview of different societies? This blog explores over 15,000 years of maps, from Europe to Polynesia.
OER Project Map Index
Dive into our collection of political, thematic, and regional maps on a variety of world history topics.

OER Project: World History Maptivities Archive
Find a treasure trove of OER Project geography activities for all our world history courses.
Teach Tomorrow: Lessons on Mapping in World History
Lesson 6.6
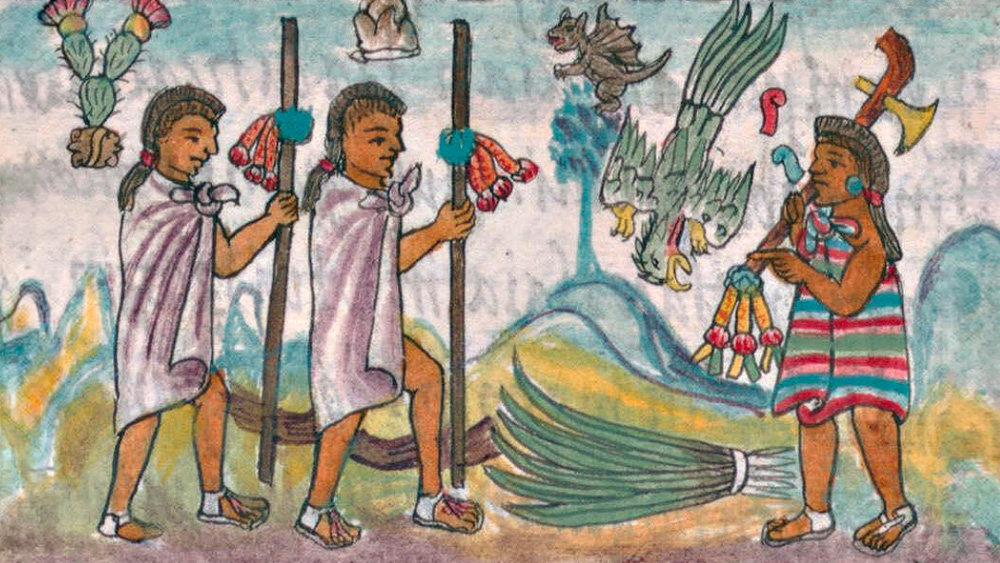
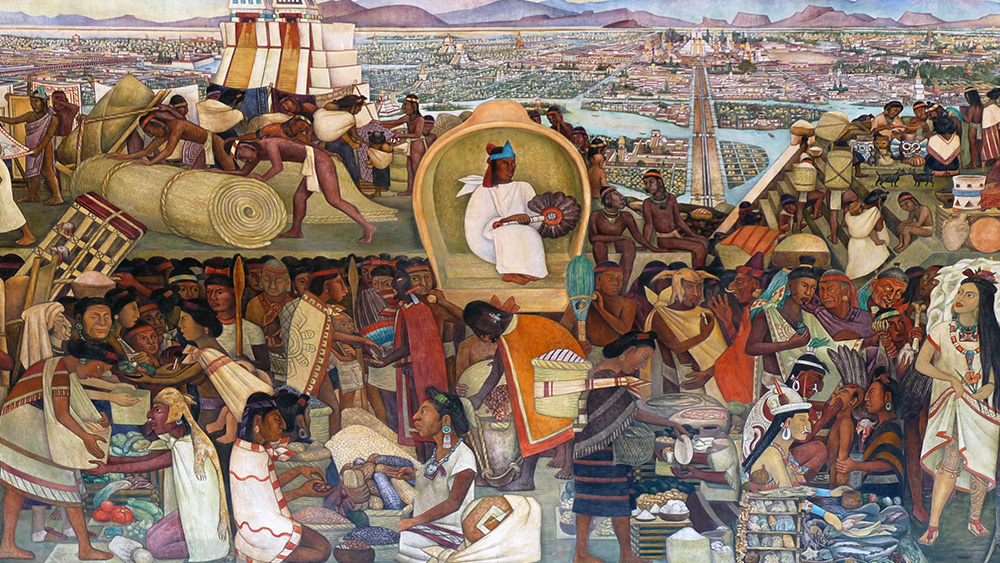
Trade Routes in the Americas
Indigenous Americans forged networks of exchange that stretched across Mesoamerica, the Caribbean, the Andes, the Amazon Basin, and North America.
View Lesson
Lesson 3.4.2
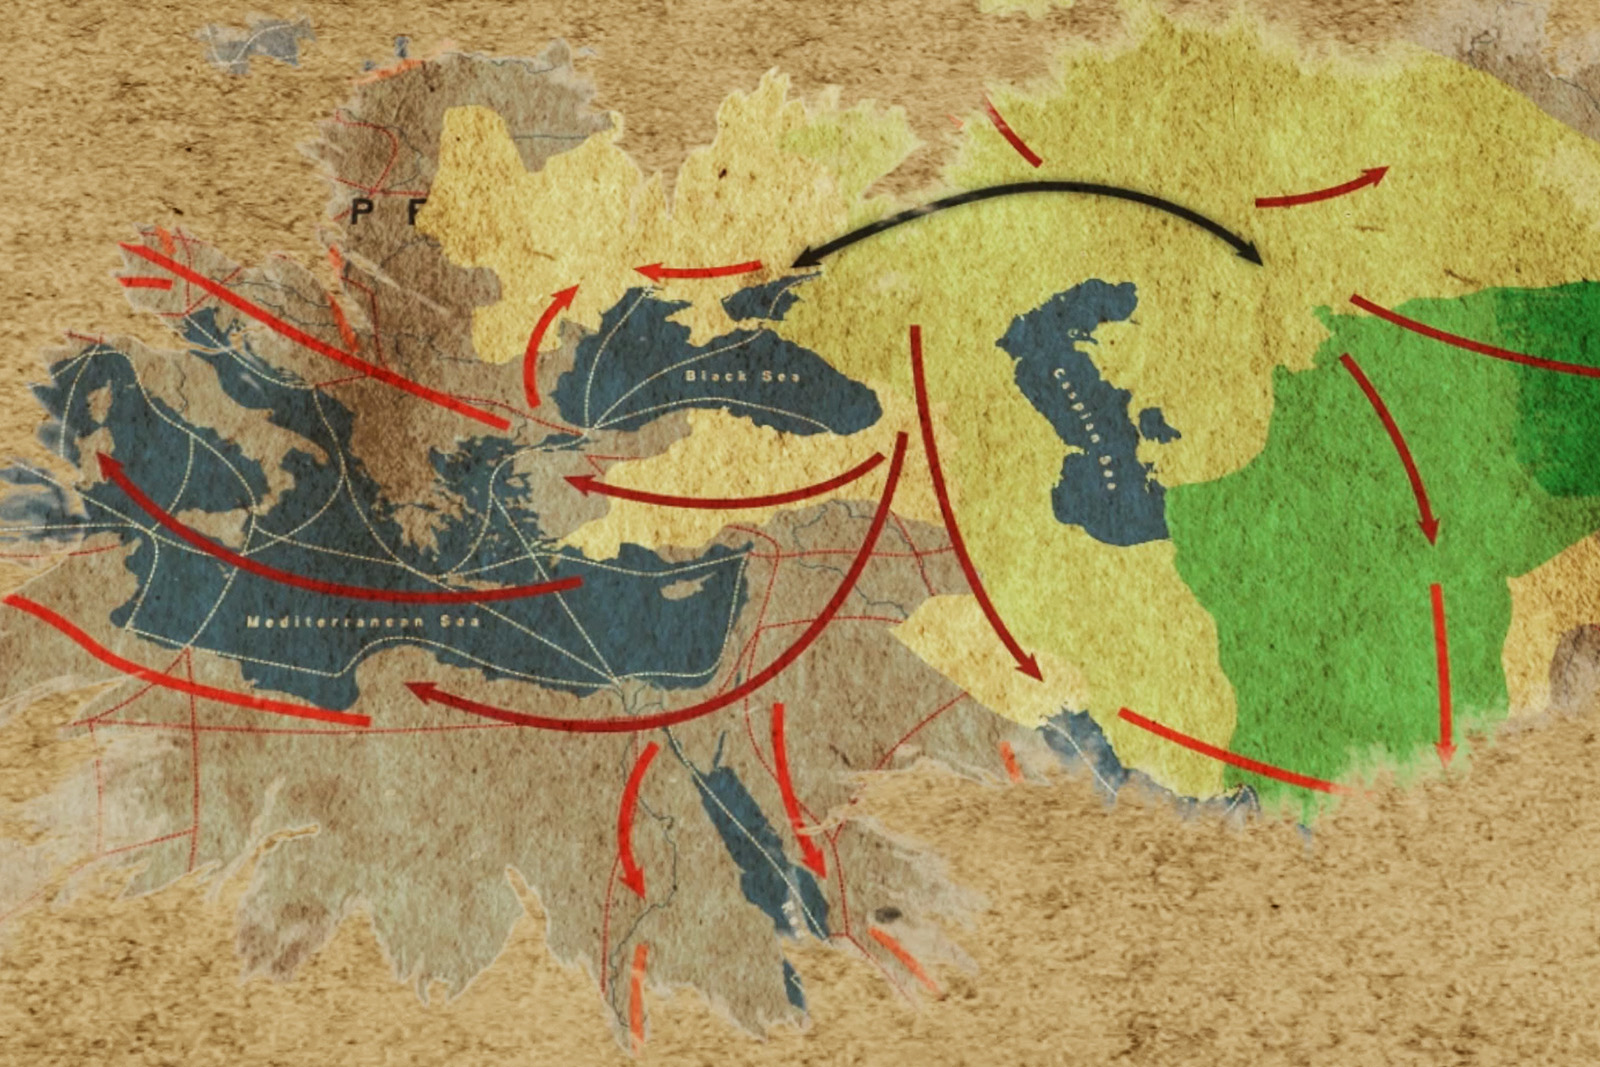
Ancient Trade Routes
In this lesson, students use an article about ancient trade as they map regional networks in the linked activity.
View Lesson
Thematic World Maps
Students can use these thematic world maps as evidence to support, extend, and challenge the historical narratives they’re encountering in your course.
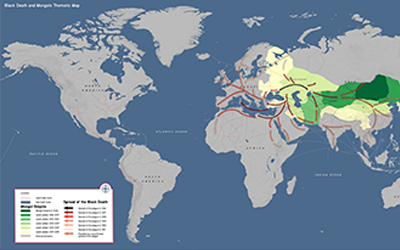
Black Death and Mongols Thematic Map
Map
Black Death and Mongols Thematic Map
This map will help students trace the relationships linking the Mongol Empire, long-distance trade, and the spread of the Black Death in the 14th century.
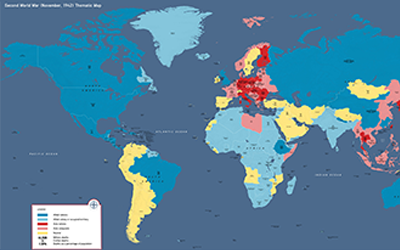
Second World War (November, 1942) Thematic Map
Map
Second World War (November, 1942) Thematic Map
This world map reveals the global alliances of World War 2 and details the millions of civilian and military casualties from every nation and colony.
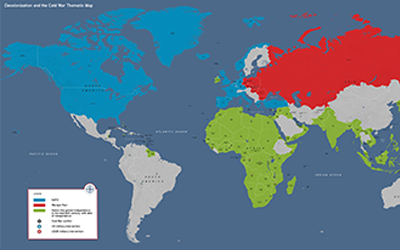
Decolonization and the Cold War Thematic Map
Map
Decolonization and the Cold War Thematic Map
Uncover the linkages between the Cold War and decolonization with this world map, which highlights the many proxy wars that kept the Cold War hot.
Regional Maps for Teaching World History
Use these highly detailed regional maps to zoom in on world-historical topics.
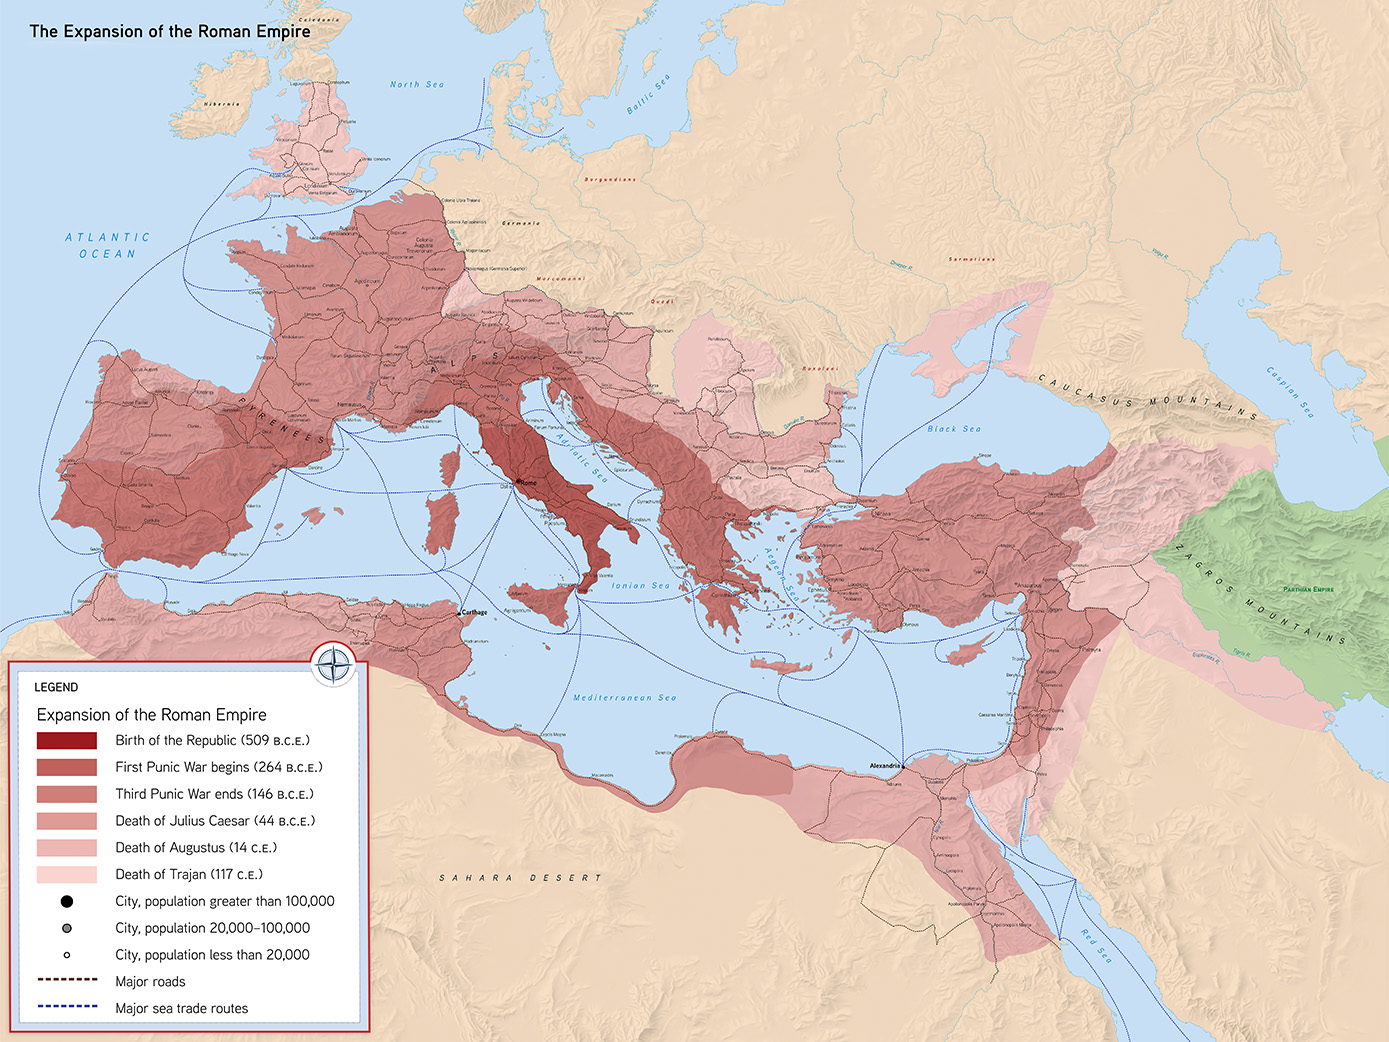
Expansion of the Roman Empire Map
Map
Expansion of the Roman Empire Map
Use this detailed map to see how the Roman Empire expanded and the vital roads and sea routes that linked its far-flung cities.
Map of the Holocaust
Map
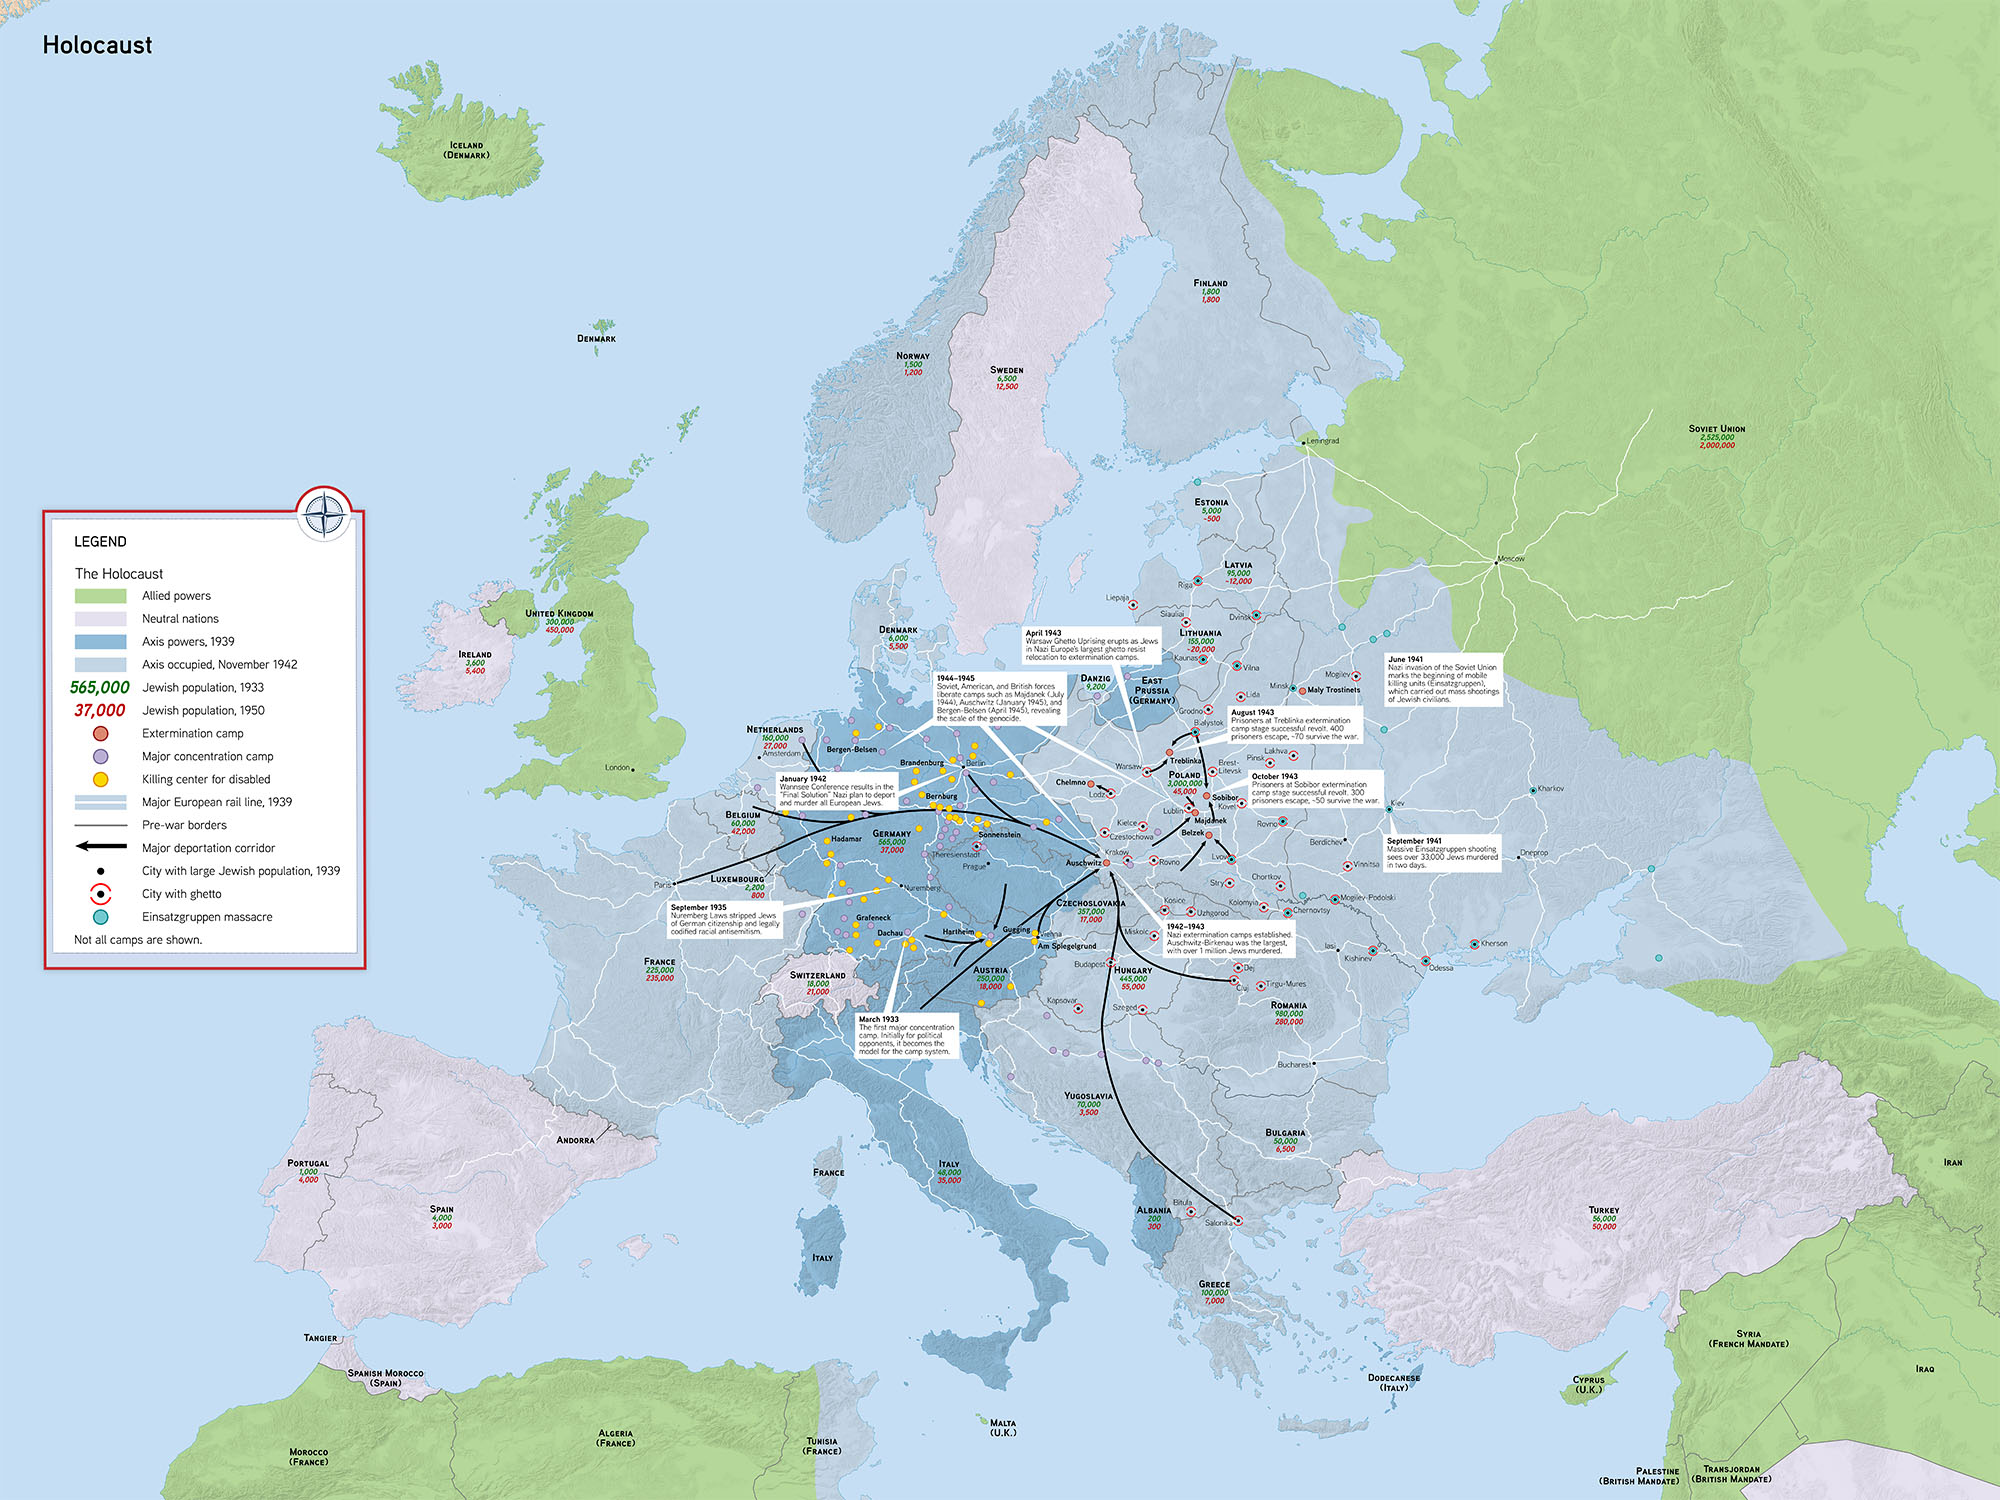
Map of the Holocaust
This map helps reveal the scale and brutality of the Holocaust, as the Nazis deployed camps and mobile killing units across the European continent.
Colonization of Africa Map
Map
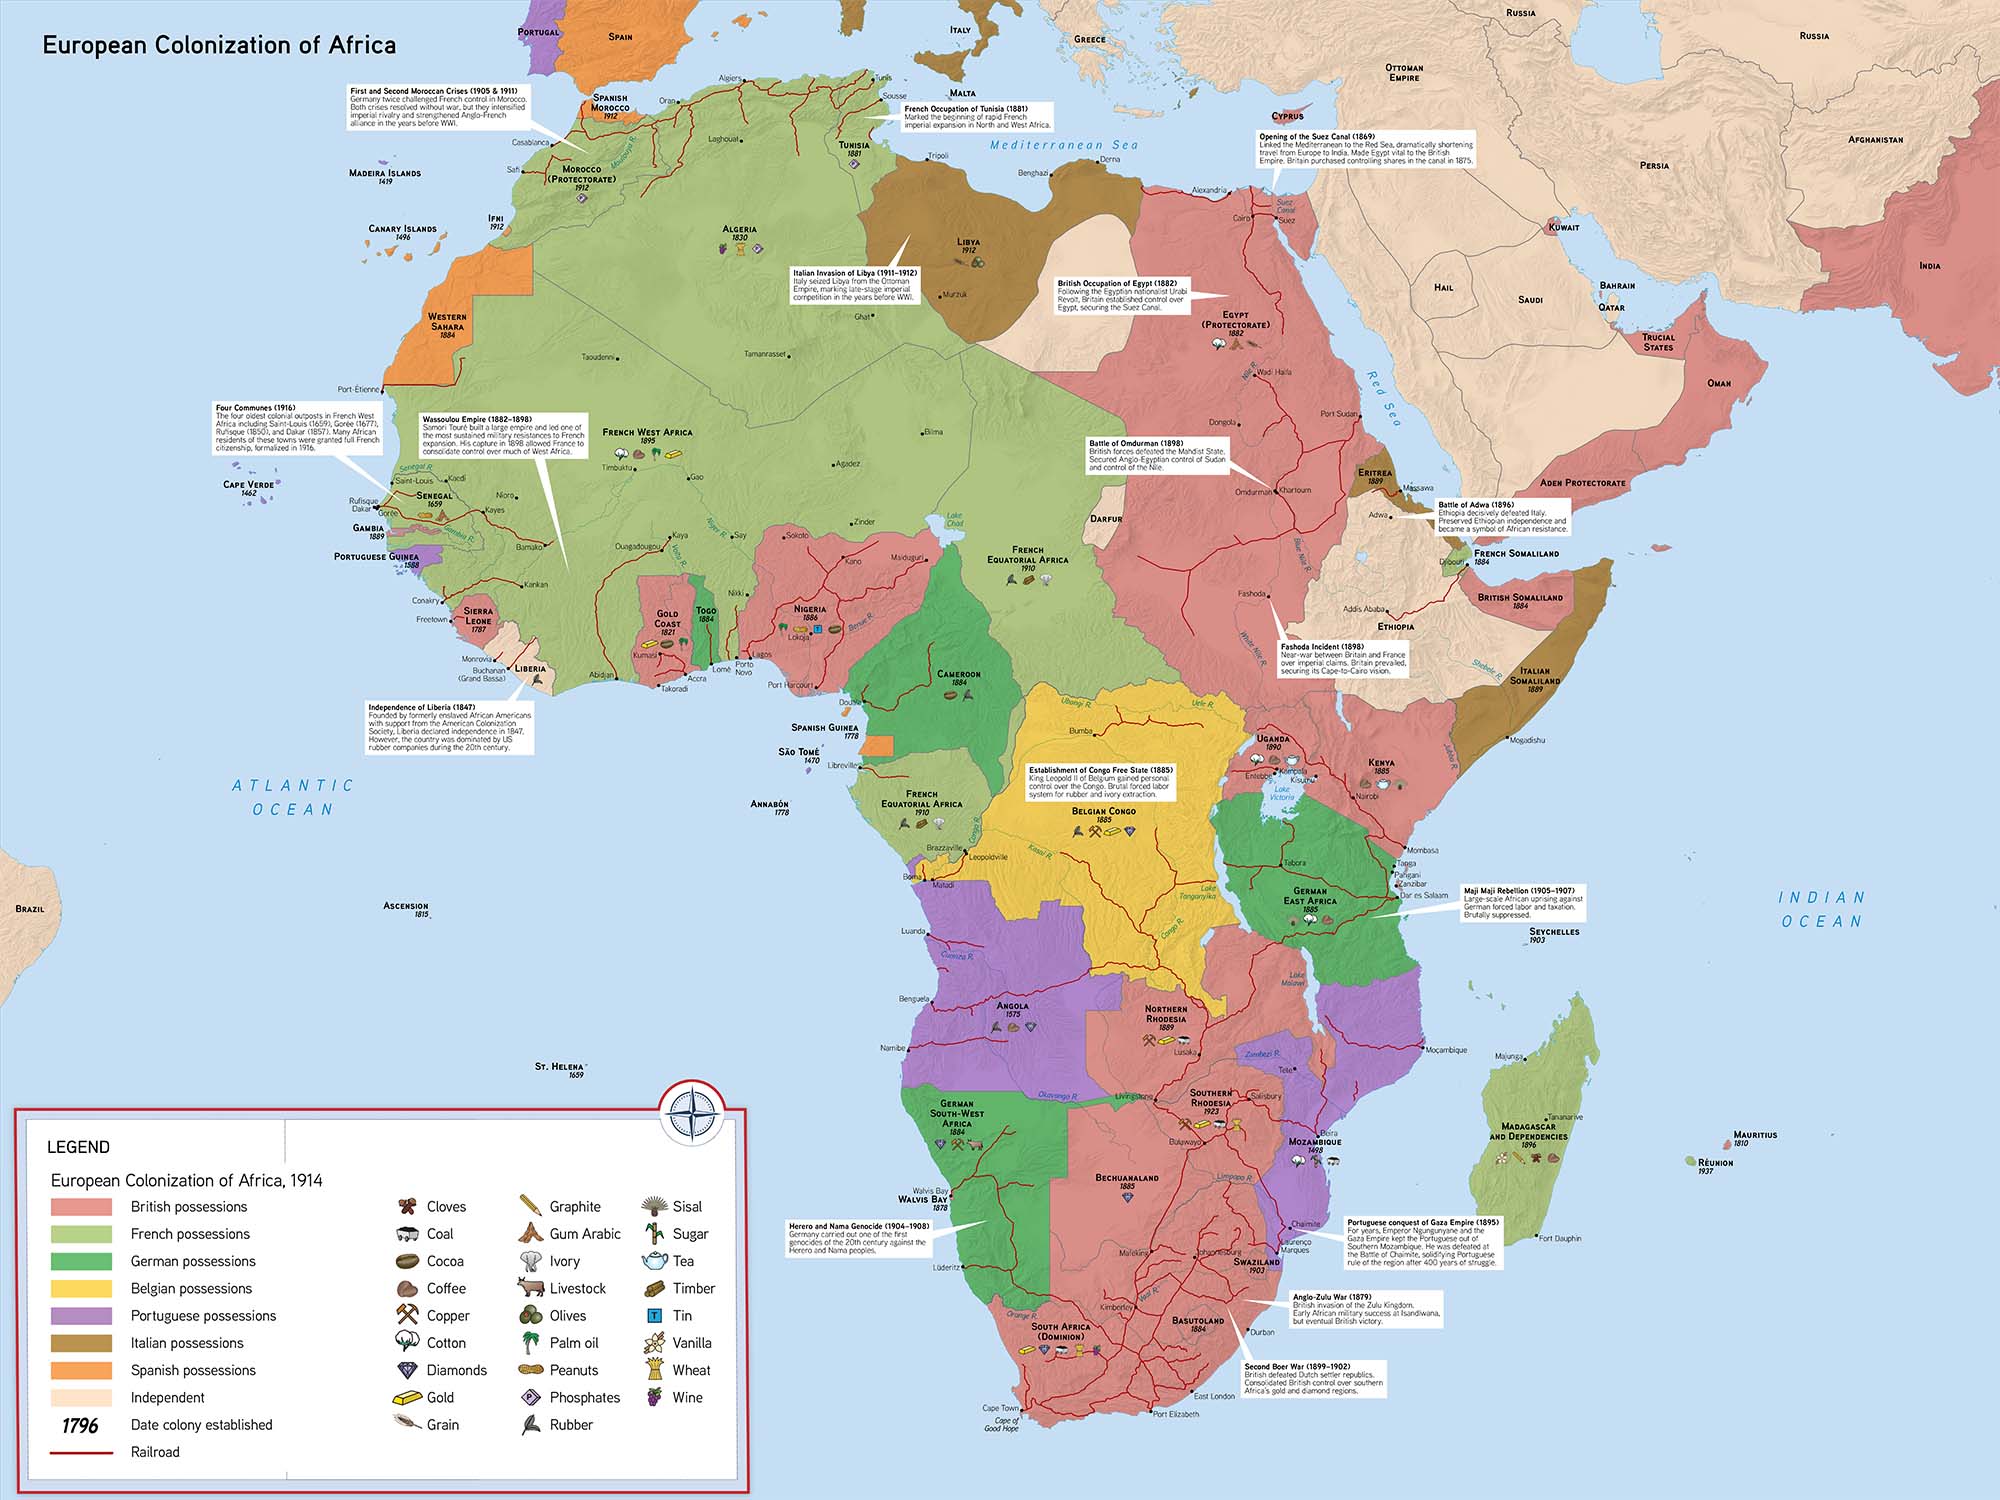
Colonization of Africa Map
This map shows the extent of European imperialism in Africa after the Berlin Conference (1885). The map includes resource extraction and narrative text.
Political World Maps
These political world maps show snapshots of the world in different centuries. They can help students see change and continuity over time as empire grow and collapse and borders move.
1650 CE Political Map
Map
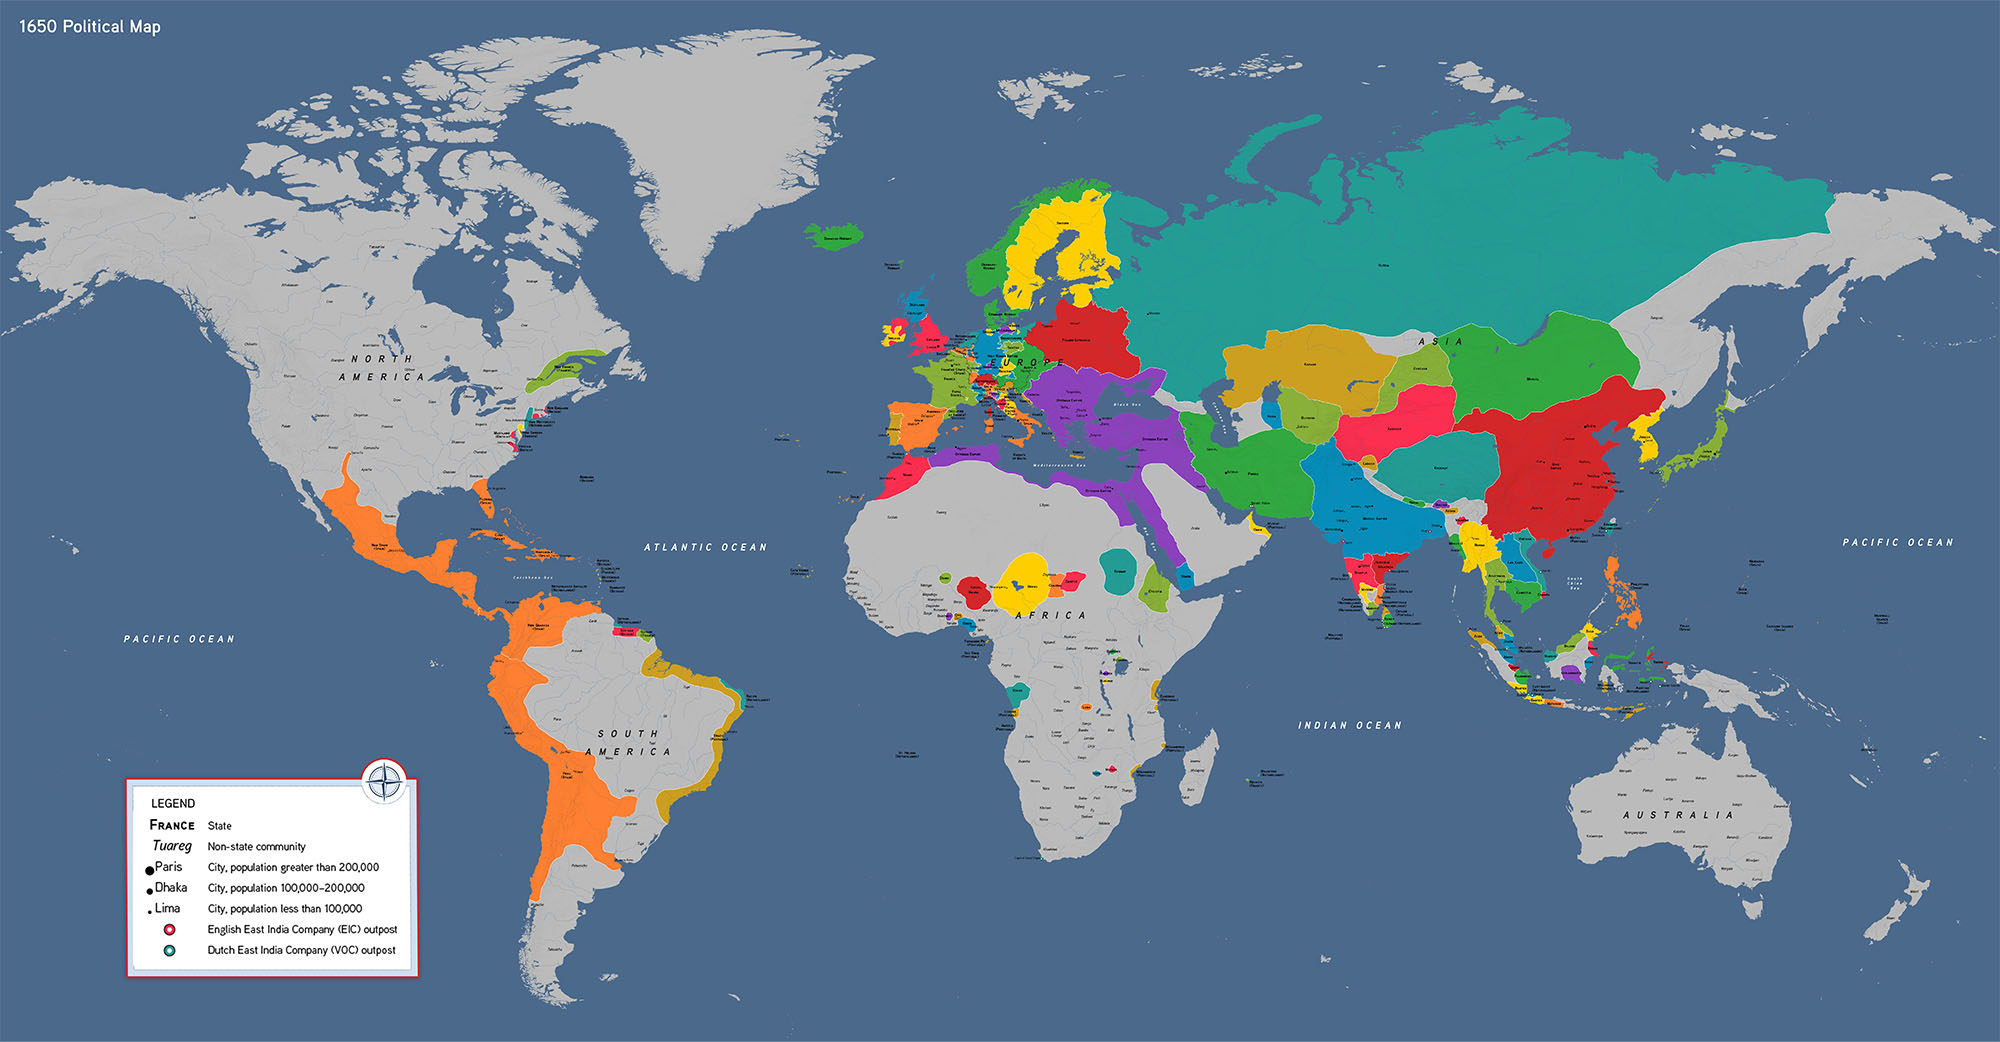
1650 CE Political Map
This map of the world in the seventeenth century shows the expansion of maritime empires in the Americas, and in the Indian Ocean, where the East India Company was expanding its reach.
1789 CE Political Map
Map
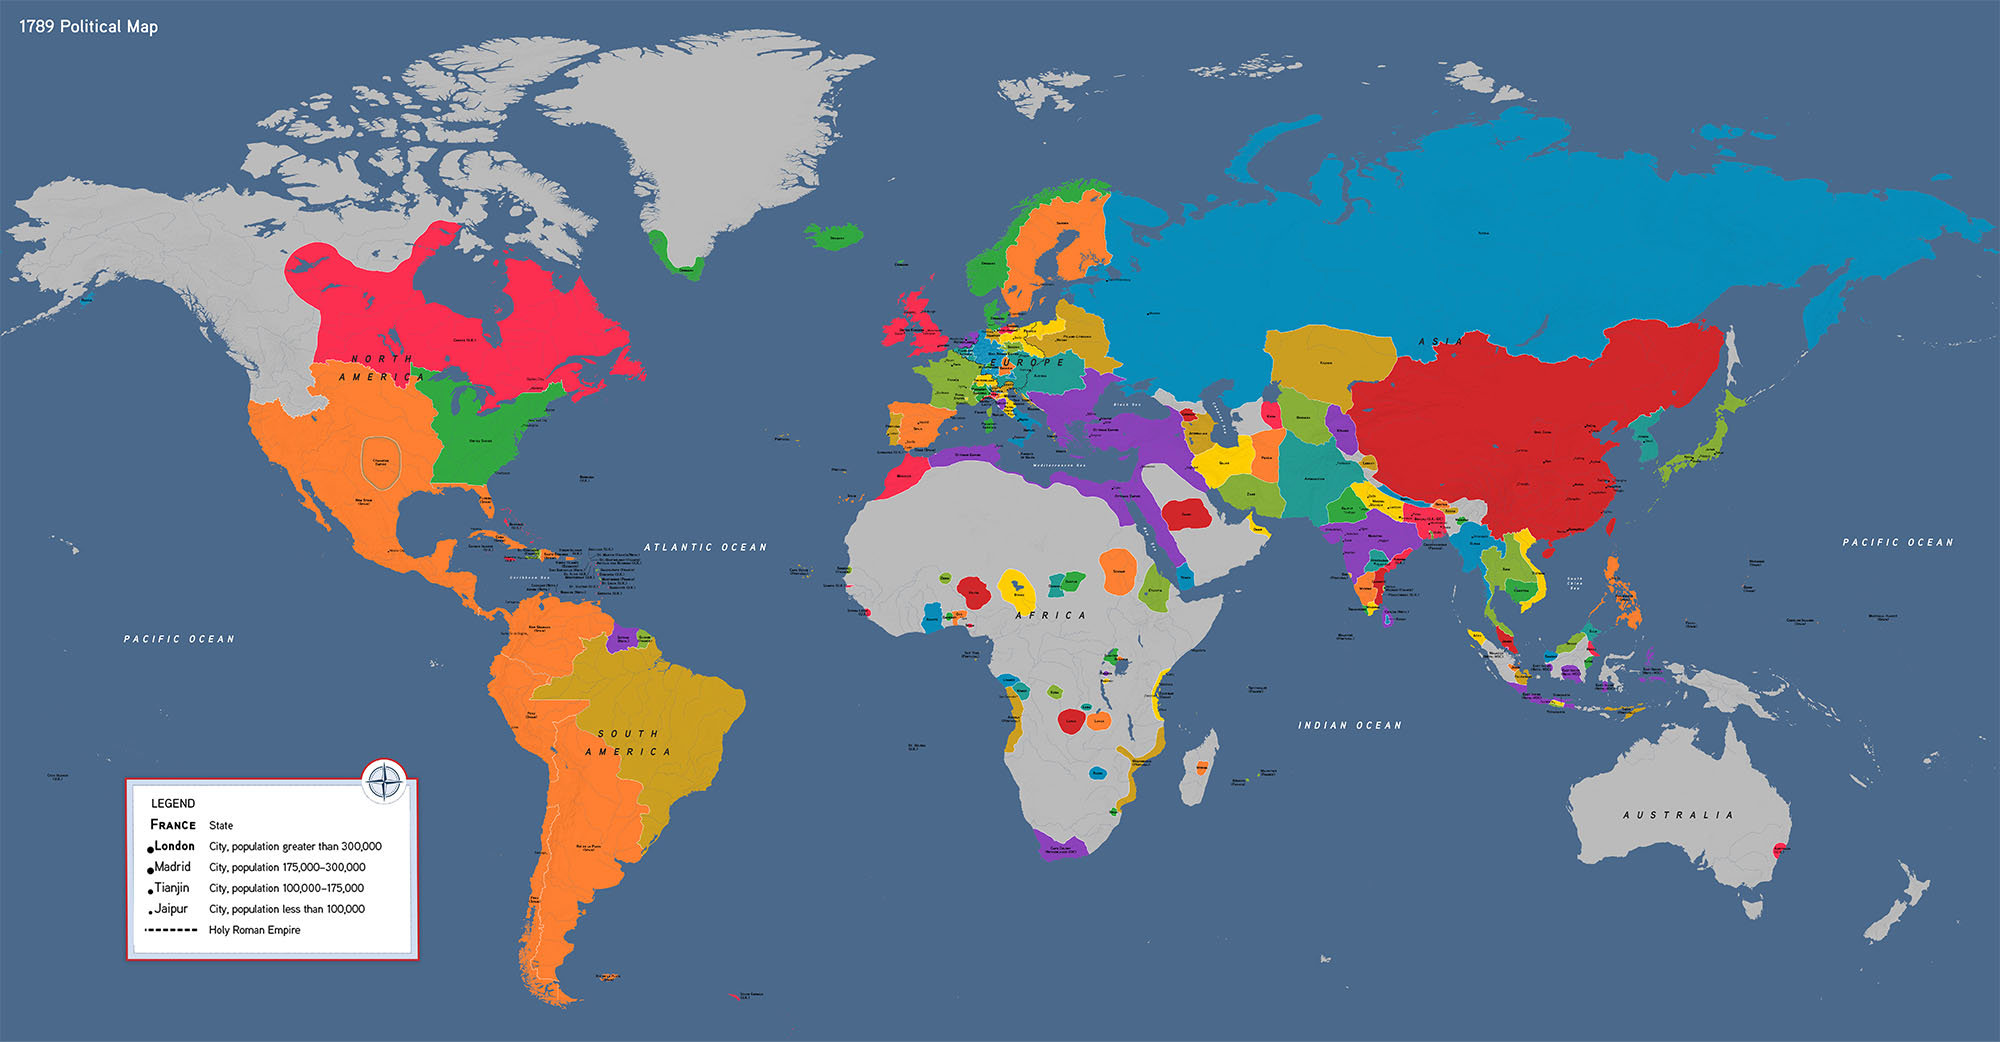
1789 CE Political Map
Explore a world on the eve of the French Revolution, as European colonies expand in the Americas, and the newly independent United States looks westward.
1939 CE Political Map
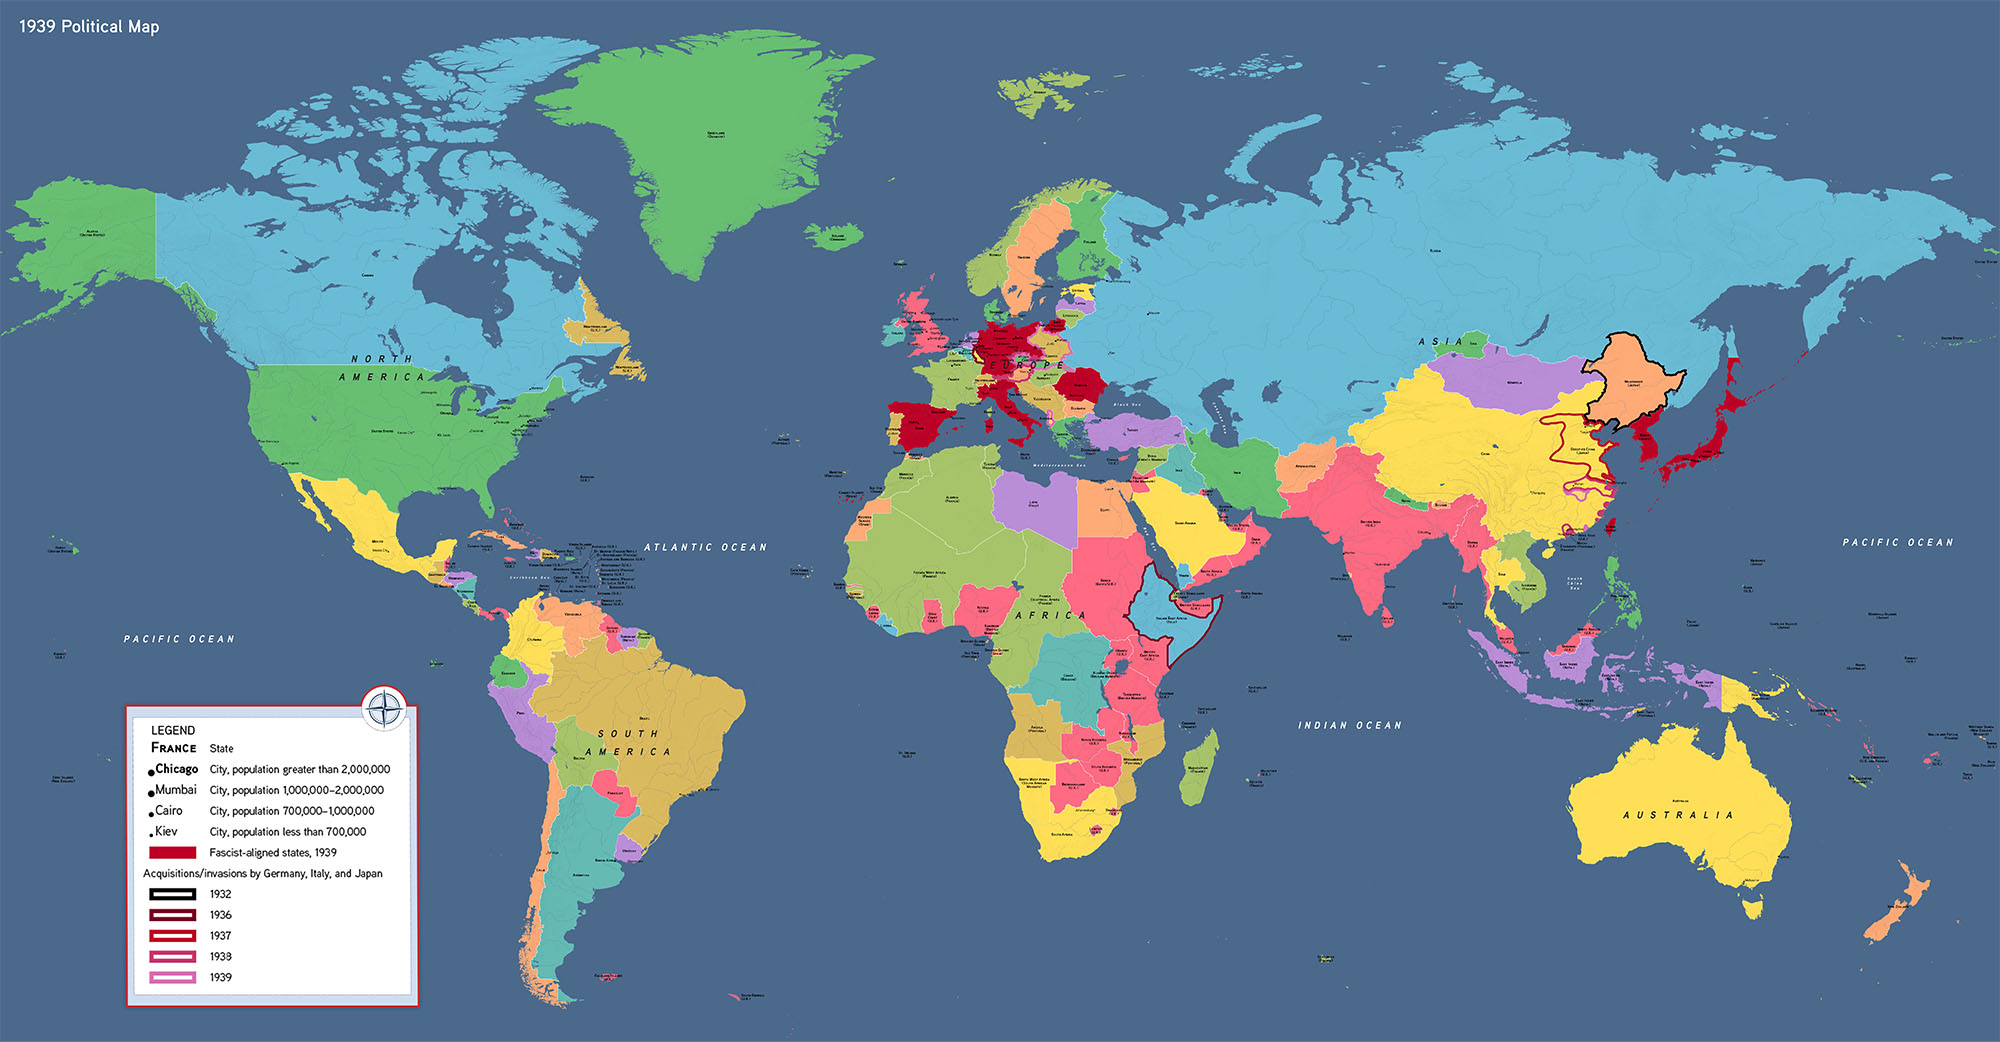
Map
1939 CE Political Map
See how fascist regimes expanded in the decade before the Second World War, conquering new colonies and securing alliances abroad.
Resources to Connect Climate Change and Geography
Geography is the study of the physical features of the Earth and how it has affected humanity. But it is also the study of humanity’s impact on the planet. These resources provide students with evidence and maps for understanding climate change.
Mapping a Climate Future
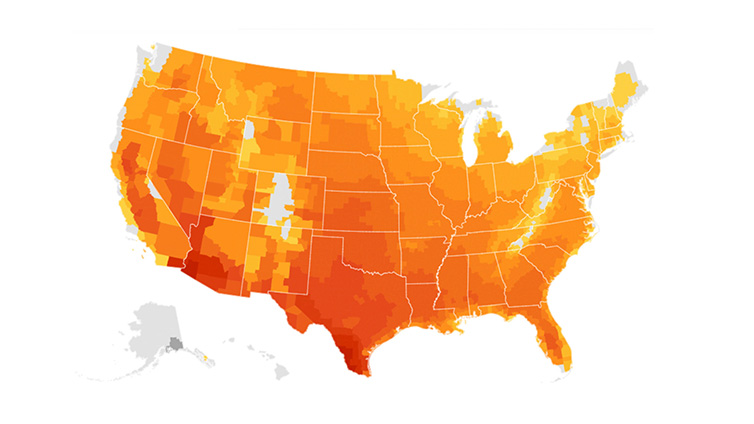
Activity
Mapping a Climate Future
Investigate data through climate maps to visualize what extreme heat looks like now, and what scientists predict it will look like in the future.
Climate Impacts: Sea-Level Rise
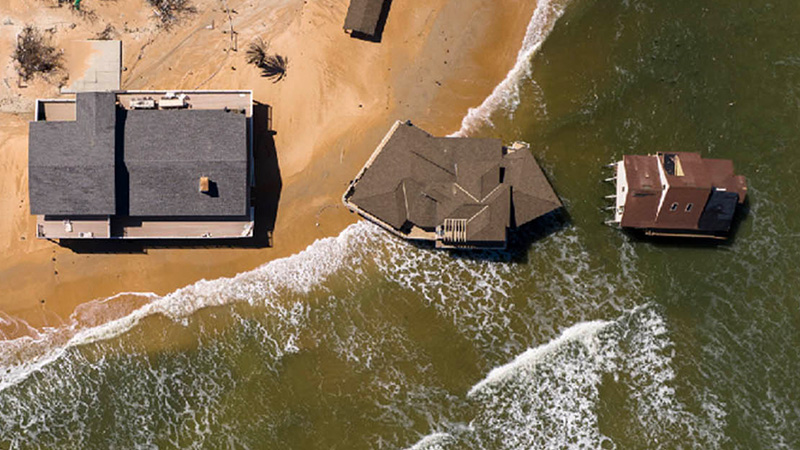
Article
Climate Impacts: Sea-Level Rise
This data exploration focuses on global sea-level rise—its connections to greenhouse gas emissions and how it is reshaping our world.
Data Investigation

Opener
Data Investigation
Maps, charts, and graphs are pretty common tools for understanding climate change. See what you can learn from one chart in this opening activity.
