
Data Exploration: Greenhouse Gas Emissions
Greenhouse Gas EmissionsData Introduction By Hannah Ritchie and Max RoserAdapted by Eman M. ElshaikhIt’s getting hot out there, folks. These charts provide an overview of historic changes in average temperature and greenhouse gas emissions— with an eye toward the future.1280LLearn more at www.oerproject.com
CO2 and Greenhouse Gas Emissions Data IntroductionBy Hannah Ritchie and Max Roser2IntroductionLately, there has been a lot of talk about carbon footprints. What people are referring to is carbon dioxide, a gas that contributes to the warming of the Earth’s climate. Your carbon footprint measures the amount of carbon dioxide that is produced from your daily activities: the energy you consume, things you buy, and food you eat. But carbon dioxide is just one of many greenhouse gases. Greenhouse gases create the “greenhouse effect,” which warms the Earth’s climate. That’s not necessarily a bad thing. In fact, we need these gases—like carbon dioxide (CO2), nitrous oxide, methane, and others—to keep the temperature of the planet livable for many organisms—including us. If there were absolutely no greenhouse gases (GHGs), the average surface temperature of the Earth would be about -18 degrees Celsius1 (This equals about 0 degrees Fahrenheit.)Particularly since the Industrial Revolution, energy production has gone up dramatically. Energy production using fossil fuels has led to a rapid increase in GHGs, which has led to global warming. Climate change has a range of possible effects on the environment and on people’s health. It can make extreme weather events, like floods, droughts, storms, and heatwaves more common and intense. It can cause the sea levels to rise, plants to grow differently, and water systems to change.2In light of this evidence, UN member parties have set a target in the Paris Agreement of limiting average warming to 2 degrees Celsius above pre-industrial temperatures. In this data exploration, you’ll get a historical perspective on how CO2 emissions have evolved, how emissions are distributed, and the key factors that both drive these trends and hold the key to limiting climate change.Looking at the data: long-term global average temperature changeTo set the scene, let’s look at how the planet has warmed. In Chart 1 we see the global average temperature and how it’s changed since 1850. The red line represents the average annual temperature trend through time. But we can’t be 100 percent precise about these temperatures, so the two light-gray lines show the possible range.In this chart, we see that over the last few decades, global temperatures have risen sharply. Overall, if we look at the total temperature increase since pre-industrial times, this amounts to approximately 1 degree Celsius. The chart also shows that the temperature increase in the Northern Hemisphere is higher (around 1.4 degrees Celsius since 1850) than in the Southern Hemisphere (around 0.8 degrees Celsius). This relates to the fact that the Northern Hemisphere has much more land than the Southern Hemisphere—and land heats and cools much more quickly than the ocean.1 Qiancheng Ma. “Greenhouse Gases: Refining the Role of Carbon Dioxide.” NASA Science Briefs, March 1998. https://www.giss.nasa.gov/research//briefs/1998_ma_01/2 The most extensive analysis on the potential impacts of climatic change can be found in a report called the 5th Intergovernmental Panel on Climate Change (IPCC) report.
CO2 and Greenhouse Gas Emissions Data IntroductionBy Hannah Ritchie and Max Roser3Chart 1:Explore at: https://ourworldindata.org/grapher/temperature-anomaly By Our World in Data, CC BY 4.0.CO2 emissions by regionSo, we know that temperatures are rising, but what’s causing it? The data shows a relationship between rising temperatures and increased emissions of greenhouse gases. Global emissions have increased from 2 billion tons of carbon dioxide in 1900 to over 36 billion tons 117 years later. Chart 2 breaks this data down by region. Chart 3 shows a map view of annual emissions in 2018.
CO2 and Greenhouse Gas Emissions Data IntroductionBy Hannah Ritchie and Max Roser4Chart 2:Explore at: https://ourworldindata.org/grapher/annual-co-emissions-by-region By Our World in Data, CC BY 4.0.
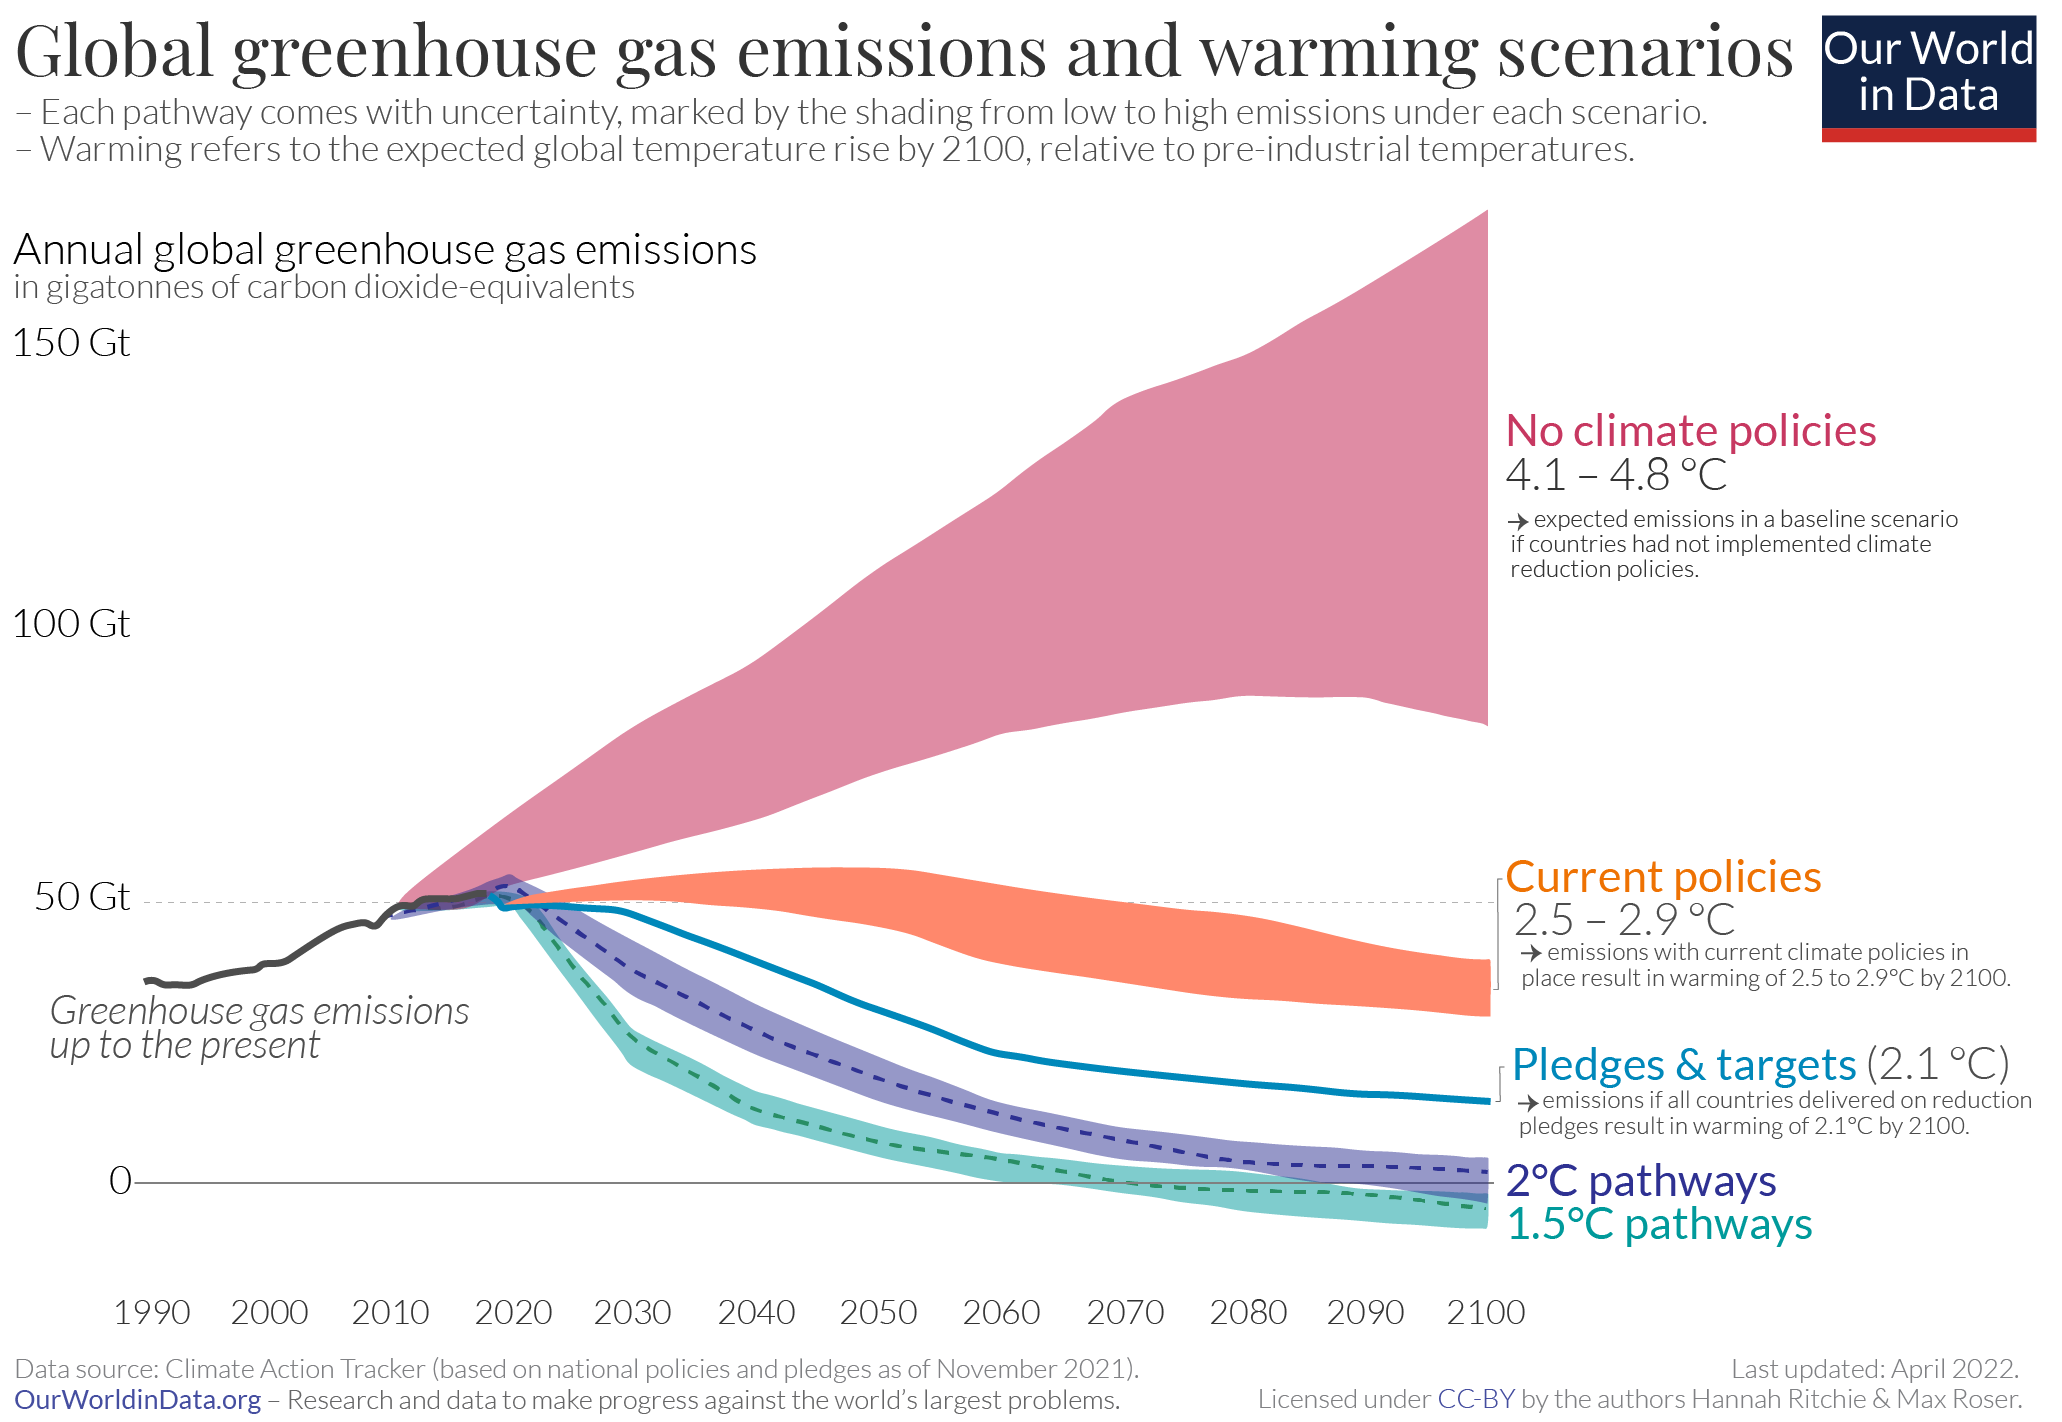
CO2 and Greenhouse Gas Emissions Data IntroductionBy Hannah Ritchie and Max Roser5Chart 3:Explore at: https://ourworldindata.org/grapher/annual-co2-emissions-per-country By Our World in Data, CC BY 4.0.Future emission scenariosWhat does the future of our carbon dioxide and GHG emissions look like? In Chart 4, we show five possible future scenarios involving GHG emissions and temperature increases:•No climate policies: Projected future emissions if no climate policies were implemented. This would result in an estimated 4.1 to 4.8°C warming by 2100 (relative to pre-industrial temperatures).•Current climate policies: Projected warming of 2.8 to 3.2°C by 2100 based on current implemented climate policies.•National pledges: If all countries achieve their current targets/pledges set within the Paris Agreement, it’s estimated average warming by 2100 will be 2.5 to 2.8°C. This would exceed the overall target of the Paris Agreement to keep warming “well below 2°C.”
CO2 and Greenhouse Gas Emissions Data IntroductionBy Hannah Ritchie and Max Roser6•2°C consistent: There are a range of emissions pathways that would be compatible with limiting average warming to 2°C by 2100. This would require a significant increase in ambition of the current pledges within the Paris Agreement.•1.5°C consistent: There are a range of emissions pathways that would be compatible with limiting average warming to 1.5°C by 2100. However, all would require a very urgent and rapid reduction in global greenhouse gas emissions.Chart 4:Explore at: https://ourworldindata.org/uploads/2018/04/Greenhouse-gas-emission-scenarios-01.png By Our World in Data, CC BY 4.0.
CO2 and Greenhouse Gas Emissions Data IntroductionBy Hannah Ritchie and Max Roser7Hannah Ritchie Hannah is Senior Researcher and Head of Research at Our World In Data. She focuses on the long-term development of food supply, agriculture, energy, and environment, and their compatibility with global development. Hannah completed her PhD in GeoSciences at the University of Edinburgh.Max RoserMax is the founder and director of Our World in Data. He began the project in 2011 and for several years was the sole author, until receiving funding for the formation of a team. Max’s research focuses on poverty, global health, and the distribution of incomes. He is also Programme Director of the Oxford Martin Programme on Global Development at the University of Oxford, and Co-executive Director of Global Change Data Lab, the non-profit organization that publishes and maintains the website and the data tools that make OWID’s work possible.Image creditsCover: Steam and exhaust rise from the chemical company Oxea (front) and the coking plant KBS Kokereibetriebsgesellschaft Schwelgern GmbH (behind) on a cold winter day on January 6, 2017 in Oberhausen, Germany. According to a report released by the European Copernicus Climate Change Service, 2016 is likely to have been the hottest year since global temperatures were recorded in the 19th century. According to the report the average global surface temperature was 14.8 degrees Celsius, which is 1.3 degrees higher than estimates for before the Industrial Revolution. Greenhouse gases are among the chief causes of global warming and climates change. © Lukas Schulze/Getty ImagesArticles leveled by Newsela have been adjusted along several dimensions of text complexity including sentence structure, vocabulary and organization. The number followed by L indicates the Lexile measure of the article. For more information on Lexile measures and how they correspond to grade levels: www.lexile.com/educators/understanding-lexile-measures/To learn more about Newsela, visit www.newsela.com/about.The Lexile® Framework for ReadingThe Lexile® Framework for Reading evaluates reading ability and text complexity on the same developmental scale. Unlike other measurement systems, the Lexile Framework determines reading ability based on actual assessments, rather than generalized age or grade levels. Recognized as the standard for matching readers with texts, tens of millions of students worldwide receive a Lexile measure that helps them find targeted readings from the more than 100 million articles, books and websites that have been measured. Lexile measures connect learners of all ages with resources at the right level of challenge and monitors their progress toward state and national proficiency standards. More information about the Lexile® Framework can be found at www.Lexile.com.OER Project aims to empower teachers by offering free and fully supported history courses for middle- and high-school students. Your account is the key to accessing our standards-aligned courses that are designed with built-in supports like leveled readings, audio recordings of texts, video transcripts, and more. Offerings include a variety of materials, from full-year, standards-based courses to shorter course extensions, all of which build upon foundational historical thinking skills in preparation for AP, college, and beyond.To learn more about the OER Project, visit www.oerproject.com