
Data Exploration: War and Peace
War and Peace Data Introduction By Max RoserAdapted by Eman M. ElshaikhThe past was not peaceful. Is there more violent conflict today than in the past? Is war becoming deadlier? The data is more complicated than you might think.
2War and Peace Data IntroductionBy Max RoserIntroductionThe past was not peaceful. Human history has been a story of conquest as much as it has been a story of peace. But many people have the idea that human history only became more violent recently. One reason why some people might have this impression is that people alive today don’t remember these conflicts. They are simply forgotten. We also have incomplete information to help remind us. Our data about historical conflicts is not perfectly accurate, but we do have some evidence that helps us estimate the number of fatalities. The visualizations below will give you a sense of these estimates.We think of recent wars—and especially the world wars of the twentieth century—as the deadliest conflicts in human history. In fact, however, there were many, many wars for land, power, and ideology that occurred long before the twentieth century. Some people argue that war has actually become less common in the last century than in previous centuries. Chart 1 shows the percentage of years the “great powers” fought each other, beginning in 1500 CE. “Great powers” are those states that are (or were) militarily or economically powerful on a global scale.Chart 1:Explore at: https://ourworldindata.org/uploads/2013/08/ourworldindata_percentage-of-years-in-which-the-great-powers-fought-one-another-1500%E2%80%932000.png By Our World in Data, CC BY 4.0.
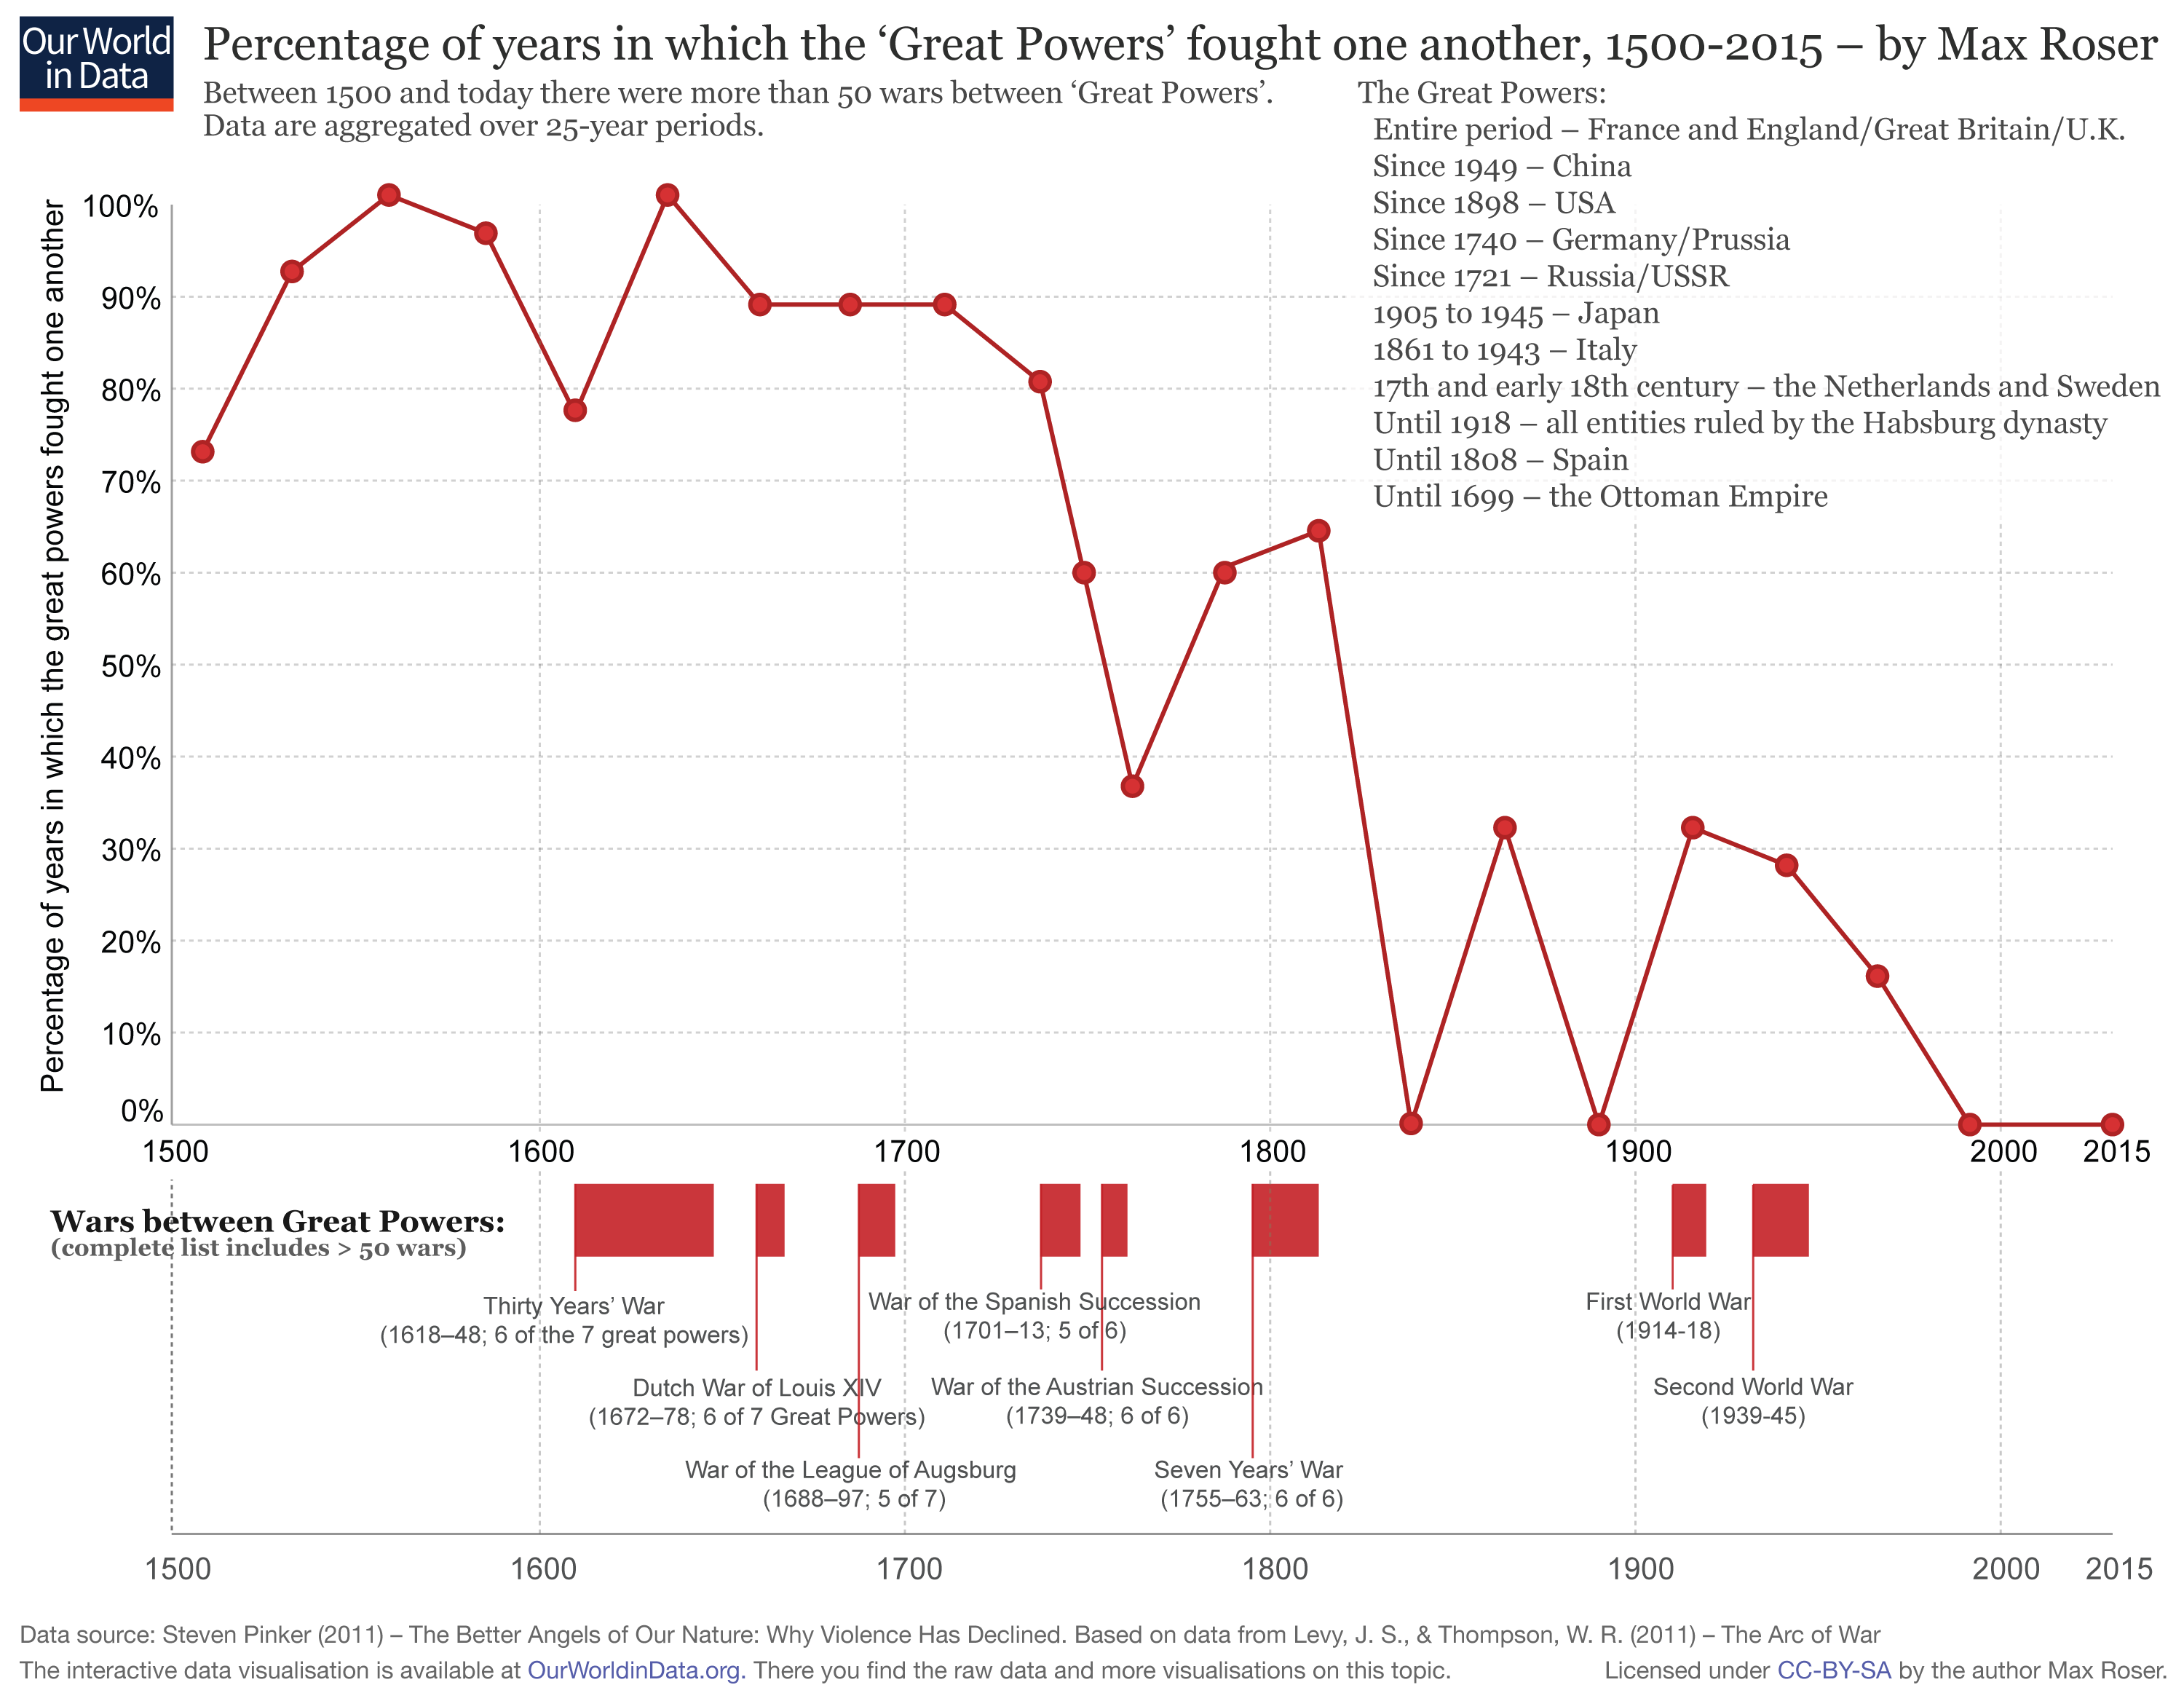
3War and Peace Data IntroductionBy Max RoserMore wars or more peace?Chart 1 seems to indicate that wars have become less common over time. But is that the whole story, or is it more complicated? To understand the role of conflict today relative to wars of the past, we can look at long-term data. Chart 2 shows deaths from global conflicts over the past 600 years or so, beginning around 1400. This helps us better understand whether humanity is trending toward more or fewer conflicts, and more-deadly or less-deadly wars. The x-axis of this chart represents time, from about 1400 CE to the present. The y-axis represents the number of people killed in war per 100,000 total population in the world.Chart 2:Explore at: https://slides.ourworldindata.org/war-and-violence/#/6 By Our World in Data, CC BY 4.0.The red circles visualize the conflicts listed in the “Conflict Catalog,” by Dr. Peter Brecke. Brecke’s data set contains information on 3,708 conflicts. For the more distant past, Brecke lacks an estimate of the number of fatalities for many of the conflicts he catalogs, and we suspect that many conflicts are completely unknown. Since the global population has changed a lot over the last 600 years, Chart 2 also provides data about the percentage of the global population that decreased as a result of these events. This will help you get a sense of how impactful these events were at the time. In addition to the individual conflicts, the chart shows an estimate of the average death rate (deaths in conflict as a percentage of the global population) from all conflict across the globe (the red line). After about 1900, there are two different estimates—one represented by the red line, the other by the blue line.
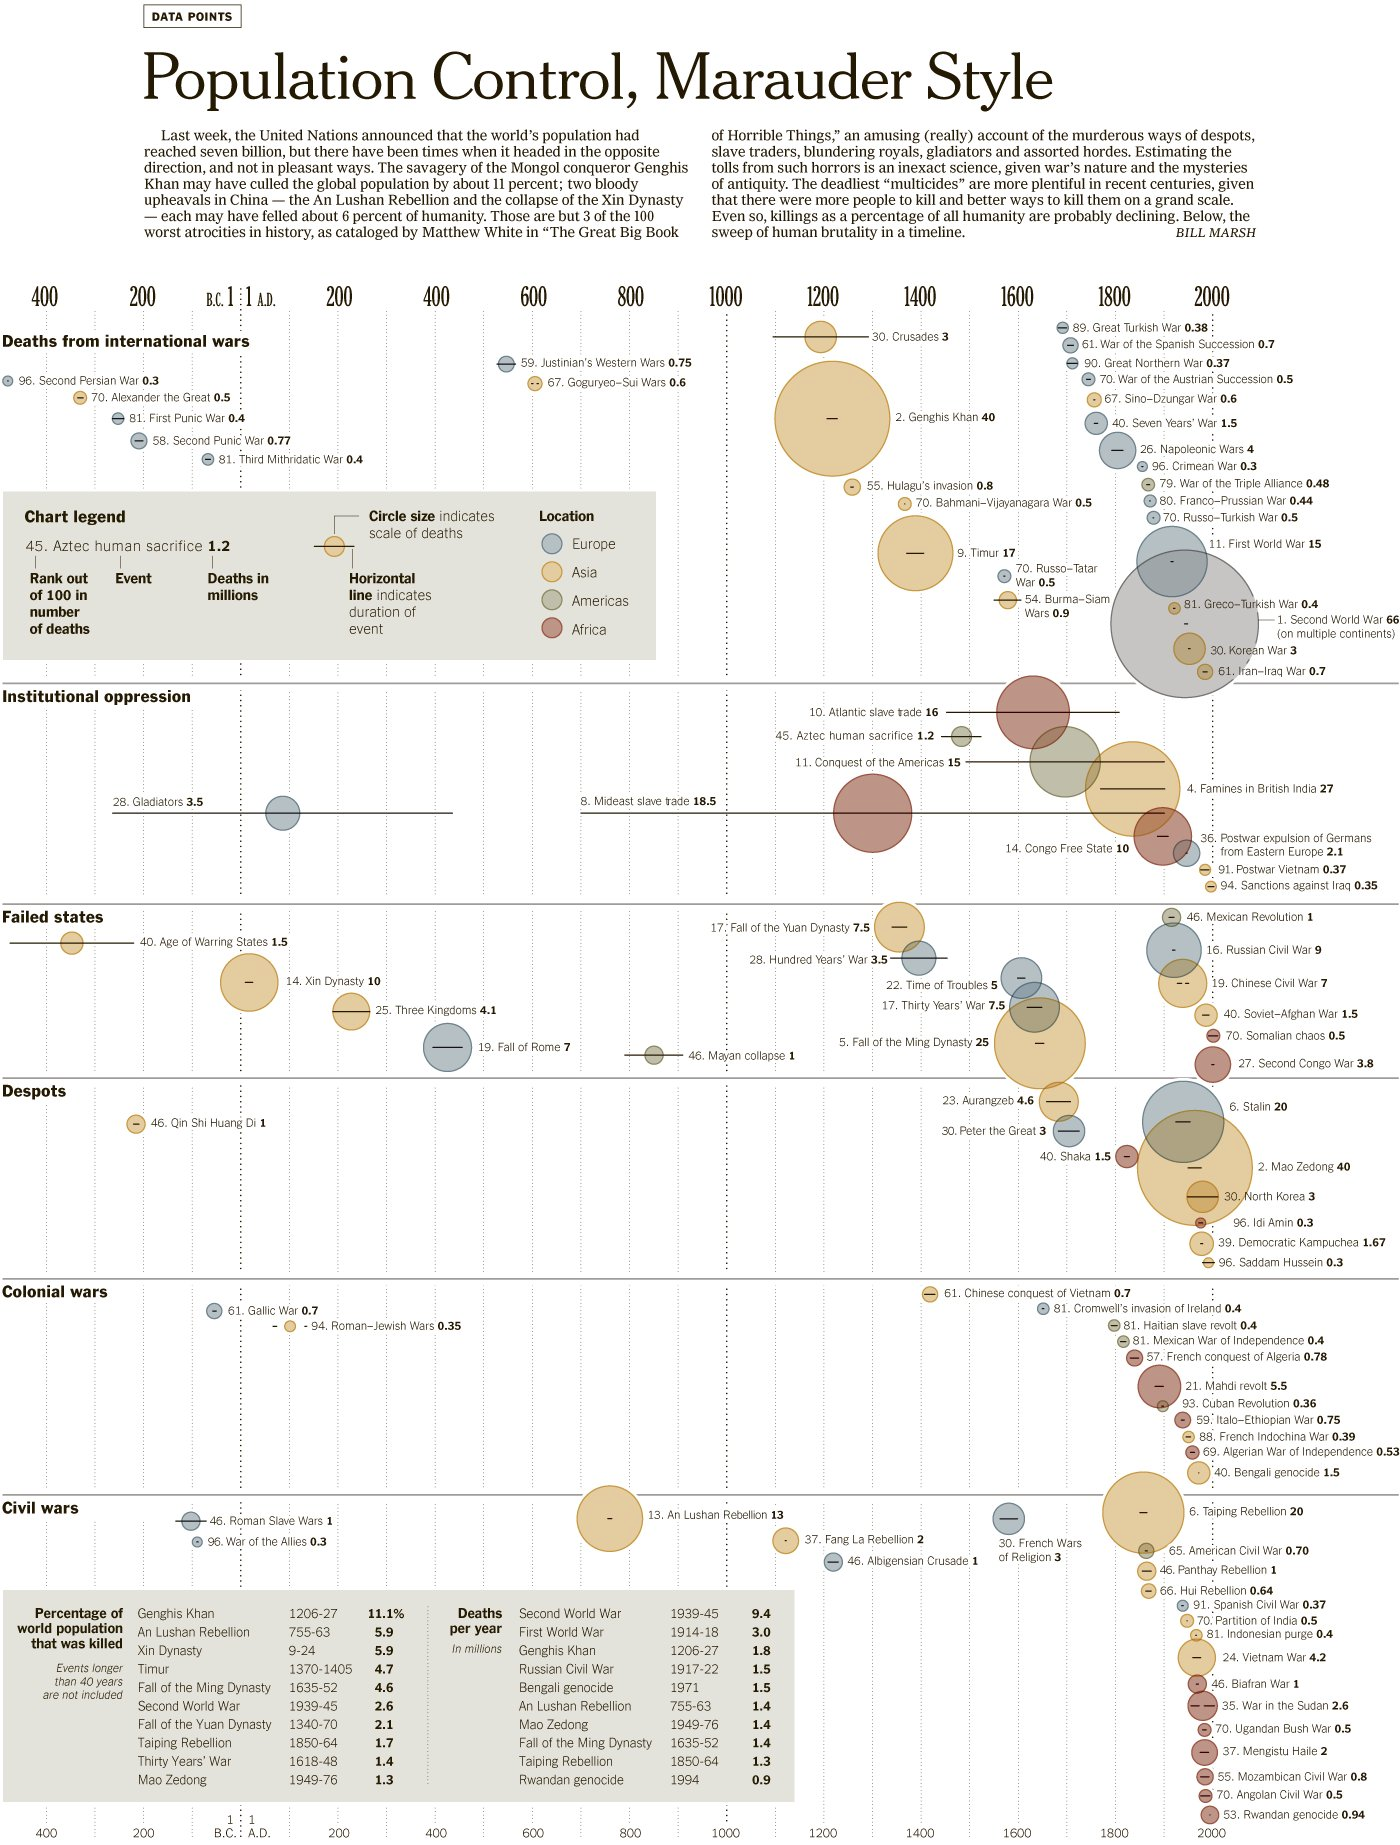
4War and Peace Data IntroductionBy Max RoserChart 3 is another visualization, one that depicts deaths from the 100 deadliest wars and other atrocities over the longer timeframe of the past millennia. The size of the circle indicates how many people died in the event, while the line through each circle indicates how long the conflict lasted. The color of each circle shows where each conflict occurred. When and where did the deadliest wars occur? Is the world becoming more peaceful, or more warlike? What factors might cause this trend to continue or to change?Chart 3:Explore at: https://ourworldindata.org/uploads/2013/08/The-100-Worst-Atrocities-over-the-last-Millennia-New-York-Times-Data-from-Matthew-White0.png By Our World in Data, CC BY 4.0.
5War and Peace Data IntroductionBy Max RoserMax RoserMax is the founder and director of Our World in Data. He began the project in 2011 and for several years was the sole author, until receiving funding for the formation of a team. Max’s research focuses on poverty, global health, and the distribution of incomes. He is also Programme Director of the Oxford Martin Programme on Global Development at the University of Oxford, and Co-executive Director of Global Change Data Lab, the non-profit organization that publishes and maintains the website and the data tools that make OWID’s work possible.Image creditsCover: An SDF fighter walks down a empty street amid destruction on February 16, 2019 in As Susah, Syria. Civilians have begun returning to some small towns close to Bagouz that were recently liberated by the US-led coalition and the Syrian Democratic Forces (SDF). Fighting continues in a small section in the west of Bagouz. SDF General Ciya announced today that ISIl fighters were holding just a 700sq meter area. © Chris McGrath/Getty Images https://www.gettyimages.com/detail/news-photo/an-sdf-fighter-walks-down-a-empty-street-amid-destruction-news-photo/1125255489